
Monitoring: Essential Strategies for Enhanced Data Security
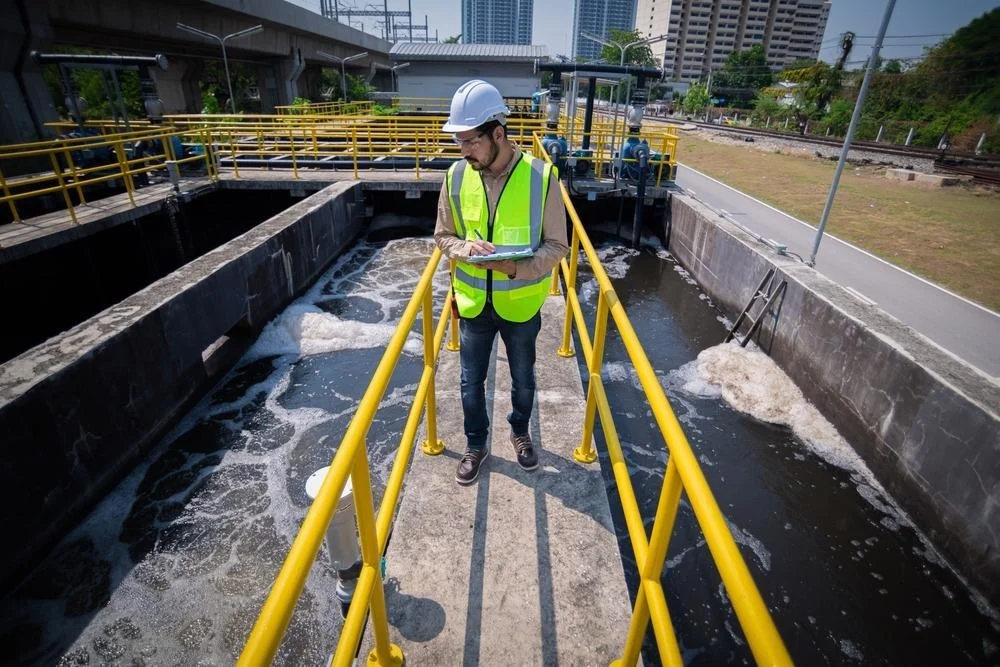
Monitoring is crucial to understanding and maintaining various systems, whether in healthcare, environmental science, or technology. It ensures that everything operates as expected and identifies potential issues before they become critical problems. In particular, effective monitoring can play a key role in areas like water quality monitoring, which helps maintain public health and environmental standards.
Having a robust monitoring system in place can save time, money, and lives. From tracking patient health remotely to assessing water quality in lakes and rivers, the technologies and methodologies have become more advanced. These systems provide real-time data, allowing for quicker responses to any abnormalities or concerns that arise.
Incorporating advanced technologies like sensors and remote monitoring can significantly enhance the accuracy and efficiency of data collection. This not only provides a clearer picture of what is happening but also helps in making informed decisions. By understanding and utilizing these technological advancements, industries can ensure regulatory compliance and better stakeholder communication.
Key Takeaways
- Monitoring is essential for identifying issues early.
- Advanced technologies improve data accuracy and efficiency.
- Effective systems support regulatory compliance and safety.
Importance of Monitoring Water Quality
Monitoring water quality is crucial. It helps detect contaminants and pollutants that could harm human health. Water systems must follow strict regulations to ensure safety. For instance, the EPA’s Final PFAS National Primary Drinking Water Regulation requires regular monitoring to catch any issues early.
Why Does Water Quality Need to Be Monitored?
Water quality impacts numerous areas of life. Clean water is essential for drinking, agriculture, and industry. Contaminated water can cause illness and reduce the usability of water for farms and factories.
Monitoring helps manage and minimize risks. For example, post-wildfire water quality can be severely affected. The USGS highlights the delay in severe impacts, often occurring months or years later.
Important Aspects of Water Quality Monitoring
- Detection of Contaminants: Regular checks for harmful substances like chemicals, pathogens, and heavy metals.
- Assessment of Safety: Ensuring water meets health standards and guidelines.
- Environmental Protection: Protecting ecosystems from pollution and degradation.
- Regulatory Compliance: Following governmental regulations to avoid penalties and ensure public safety.
Key Benefits
- Health Protection: Safe drinking water reduces disease and health issues.
- Economic Impact: Clean water supports agriculture, industry, and recreational activities.
- Sustainability: Maintains long-term water availability and ecosystem health.
Effective water quality monitoring is vital for a healthy, sustainable society. It ensures that water is safe for every use, from drinking to farming, and helps protect the environment.
Principles of Water Quality Assessment
Effective water quality assessment involves understanding various parameters that influence water health and setting clear standards and benchmarks to measure these against. This process is critical for maintaining both environmental and human health.
Defining Water Quality Parameters
Water quality parameters are specific indicators used to assess the condition of water. These include physical properties like turbidity and temperature, chemical constituents such as pH levels and dissolved oxygen, and biological factors, including bacterial presence.
Monitoring these parameters can detect pollutants, such as PFAS, and provide insight into nutrient levels and the presence of metals. Each parameter requires specific tests to ensure accurate measurement. Regular testing and monitoring are essential for assessing and ensuring safe water standards.
Establishing Baselines and Benchmarks
Baselines and benchmarks are critical for evaluating water quality. A baseline represents the normal levels of various parameters under typical, undisturbed conditions. Benchmarks, on the other hand, are the established standards that water quality must meet to be considered safe.
Creating these standards involves extensive data collection and analysis, often involving federal guidelines such as those from the EPA. Consistently measuring against these benchmarks helps in identifying pollution sources, understanding long-term trends, and making informed decisions to protect water resources.
Monitoring Technologies
Monitoring technologies play an essential role in various fields such as environmental science, medicine, and manufacturing. These technologies can include sensor-based solutions, remote sensing tools, and laboratory analysis methods, each offering unique benefits and applications.
Sensor-Based Solutions
Sensor-based solutions are crucial for real-time monitoring. These devices measure physical parameters like temperature, pressure, humidity, and chemical concentrations.
For instance, water quality monitoring equipment uses sensors to track parameters such as pH, dissolved oxygen, and turbidity. This data can help in maintaining safe drinking water standards and detecting pollution. In healthcare, wearable sensors monitor vital signs like heart rate and blood pressure, providing real-time data to patients and doctors.
The integration of sensors with IoT (Internet of Things) enhances their functionality, enabling remote access and continuous monitoring. Users can receive alerts and take timely actions based on sensor readings.
Remote Sensing Tools
Remote sensing tools collect data from a distance, often using satellites or drones. These tools are invaluable for large-scale environmental monitoring.
In agriculture, remote sensing helps monitor crop health, soil conditions, and water usage. This information assists farmers in making informed decisions about irrigation and pest control. For environmental studies, remote sensing provides data on deforestation, urban sprawl, and climate change effects.
In the field of water quality monitoring systems, remote sensing can detect algal blooms and track changes in water bodies. This technology complements ground-based sensors by providing a broader overview of the monitored area.
Laboratory Analysis Methods
Laboratory analysis involves collecting samples and analyzing them in a controlled environment. This method is used when precise measurements and detailed analysis are required.
Water samples analyzed in laboratories can detect trace levels of contaminants and pathogens. This is essential for ensuring compliance with public health regulations and environmental standards. In medicine, laboratory analysis of blood or tissue samples can provide comprehensive information about a patient’s health, aiding in accurate diagnosis and treatment.
Laboratory methods often serve as a benchmark to calibrate and validate sensor-based and remote-sensing data, ensuring the accuracy and reliability of findings.
Monitoring Subcategory Overview
Water quality monitoring is not a single discipline but a family of related equipment categories, measurement techniques, and target analytes. The sections below organize that landscape into seven clusters, moving from the core instrumentation found in nearly every treatment plant through to emerging sensing science still in the research stage. Engineers specifying a monitoring program typically draw from several of these clusters at once, because no single technique covers the full range of parameters, response times, and detection limits a modern utility needs.
Sensors and Analyzers
The instrumentation cluster is the backbone of continuous monitoring, and the sensors and analyzers category covers the full range of in-line and immersion devices that report process conditions second by second. pH sensors and ORP sensors are the most widely deployed electrochemical instruments in the industry, governing coagulation, disinfection, and biological process control, and both share the same fundamental limitation: a glass or platinum electrode that drifts and requires scheduled buffer calibration. DO meters — increasingly optical rather than membrane-based — drive aeration control and are usually the single largest energy lever in an activated sludge plant. conductivity and TDS meters provide a fast, robust proxy for total ionic load, while turbidity meters and TSS analyzers cover the particulate side, the former as a regulatory compliance instrument and the latter as a process control tool. COD analyzers bring organic loading into the continuous domain, replacing a multi-hour laboratory procedure with a reading every few minutes. Supporting hardware matters as much as the primary elements: pressure gauges anchor hydraulic monitoring across the plant, integrated sensors and analyzers systems tie individual instruments into coherent control packages, and the failure modes documented under sensors and analyzers applications explain why a correctly specified instrument can still deliver bad data. For periodic and verification work, test kits remain indispensable — inexpensive, portable, and independent of the instrument being checked.
Flow, Metering, and Loss Detection
Flow measurement underpins every mass balance, every loading calculation, and every regulatory report a utility files. flow meters span magnetic, ultrasonic, and open-channel technologies, each with distinct installation requirements — magnetic meters need a conductive fluid and full pipe, ultrasonic transit-time meters need clean liquid and adequate straight run, and open-channel devices need a properly constructed primary element. Applied at plant scale, wastewater flow monitoring extends beyond the headworks into collection system surveys, infiltration and inflow studies, and permit compliance reporting. On the distribution side, smart metering and advanced metering infrastructure have converted the customer meter from a monthly billing device into a continuous data source capable of flagging customer-side leaks within hours. That same data feeds leak detection and pipeline asset monitoring programs, where acoustic correlation, pressure transient analysis, and district metered area balances combine to locate losses that would otherwise run undetected for years. Non-revenue water in the 15 to 30 percent range is common in aging systems, and flow instrumentation is the only way to quantify it.
Sampling and Laboratory Testing
Continuous instruments answer “what is happening now”; sampling and laboratory analysis answer “what exactly is in the water.” The samplers category covers grab sampling, time-proportional composite sampling, and flow-proportional composite sampling, and the choice among them is a compliance decision as much as a technical one, because most discharge permits specify the sampling mode explicitly. microbial testing of waters covers the indicator organism work — total coliform, E. coli, enterococci — that forms the public health backbone of drinking water and recreational water programs. Organic loading is quantified through BOD testing methods, a five-day incubation procedure whose precision limitations are well documented and which many plants now supplement with faster surrogates. Bridging the laboratory and the continuous instrument is in-situ monitoring, where the measurement is made in place rather than on an extracted sample, eliminating sample transport artifacts such as degassing, temperature change, and biological activity in the sample container.
Emerging Sensing Technologies
A substantial research effort is aimed at pushing detection limits lower and analysis times shorter than conventional instrumentation allows. microfluidic water quality monitoring miniaturizes wet chemistry onto a chip, reducing reagent consumption by orders of magnitude and enabling field-deployable analyzers for parameters that traditionally required a laboratory. Nanomaterial-based fluorescent probes are advancing on several fronts: quantum dot water sensors exploit size-tunable emission for selective heavy metal detection, while carbon quantum dots for water sensing pursue the same mechanism with lower-toxicity, lower-cost materials better suited to environmental deployment. More exotic transduction mechanisms are also under investigation, including quantum magnetomechanical water sensors and optical techniques such as surface-enhanced Raman scattering, which can identify molecular fingerprints at trace concentrations without reagents. liquid crystal-based sensors offer a label-free optical readout that can be interpreted visually, a genuine advantage for low-resource deployment. Taken together with the broader survey of revolutionary water quality technologies now reaching pilot scale, these approaches share a common gap: laboratory detection limits are impressive, but sustained performance on real matrices with fouling, interference, and biological growth remains unproven.
Water Quality Parameters and Indicators
Interpretation depends on understanding what each parameter actually indicates and how parameters interact. The relationship documented under total dissolved solids and pH levels is a good example: the two are frequently reported together, and shifts in one often signal a change in source or process that the other alone would not reveal. Process-side parameter work includes applications such as ozone retention tanks in wastewater treatment, where contact time and residual measurement together determine whether a disinfection objective has actually been met. At the receiving-water end, eutrophication monitoring tracks nutrient loading, chlorophyll-a, and dissolved oxygen sag — the indicators that reveal whether nutrient discharge limits are achieving their intended ecological outcome.
Contaminants and Contamination Targets
Monitoring programs are ultimately designed around what they are looking for. The broad framing of contaminants and contamination covers sources, transport pathways, and impact, while chemical contaminants narrows the focus to the industrial compounds, pesticides, and disinfection byproducts that dominate regulatory monitoring lists. Particulate contamination has become its own monitoring discipline: microplastics in wastewater addresses occurrence, sampling, and quantification methods, while microplastics filtration solutions covers the removal technologies that monitoring data is used to evaluate. On the biological side, biological contamination prevention and biological contamination management address the design and operational sides of the same problem — keeping biofilm, pathogens, and nuisance organisms out of distribution systems, and responding when they establish. Specialized separation questions such as water and gasoline separation arise in fuel storage and spill response monitoring, where phase behavior rather than dissolved concentration is the measurement of interest.
Manufacturers and Program Optimization
Instrument selection eventually becomes a procurement question. The survey of top water quality instrument manufacturers covers the OEMs whose analyzers, transmitters, and controllers dominate installed base in North American utilities, along with the practical considerations — parts availability, local service coverage, and communication protocol support — that often matter more than headline accuracy specifications. Monitoring data is only valuable if it changes operating decisions, and the broader work of optimizing water treatment plants is where instrumentation investment either pays back through reduced chemical and energy consumption or sits unused in a historian nobody queries.
Comparison of Monitoring Approaches
The table below compares the principal monitoring approaches on the criteria that drive program design. Values are typical or approximate and vary with instrument selection, parameter, and site conditions.
| Approach | Typical Parameters | Response Time | Detection / Accuracy | Best-Fit Use | Maintenance Profile |
|---|---|---|---|---|---|
| Continuous in-line sensors and analyzers | pH, ORP, DO, conductivity, turbidity, TSS, COD, chlorine residual | Seconds to minutes | Good precision; accuracy depends entirely on calibration discipline | Process control, alarming, energy optimization | High: cleaning, calibration, electrode or reagent replacement |
| Flow meters and smart metering | Flow rate, totalized volume, pressure | Continuous | ±0.5–2% of reading when correctly installed | Mass balance, permit reporting, leak detection, billing | Low to moderate: verification, electrode cleaning on mag meters |
| Portable meters and test kits | pH, DO, chlorine, hardness, ammonia | Minutes | Moderate; adequate for verification and spot checks | Field rounds, instrument verification, distribution sampling | Low: reagent stock rotation, periodic calibration |
| Samplers and laboratory analysis | BOD, microbial indicators, metals, organics, nutrients | Hours to days | Highest; the reference method for compliance | Permit compliance, contaminant identification, method validation | Moderate: sampler servicing, chain of custody, lab QA |
| Remote sensing | Algal bloom extent, turbidity plumes, thermal signatures | Days to weeks | Spatial coverage over point accuracy | Reservoir and watershed surveillance, source water screening | Low field burden; high data processing requirement |
| Emerging optical and microfluidic sensing | Trace metals, specific organics, molecular fingerprints | Minutes | Very low detection limits in laboratory conditions | Research, pilot programs, targeted screening | Not yet established; limited long-term field data |
Designing a Monitoring System
To design an effective monitoring system, it is important to develop a comprehensive strategy and then implement it using the right tools and methods.
Strategy Development
The first step in designing a monitoring system is to develop a clear strategy. This involves identifying the objectives of the monitoring system and determining what data needs to be collected. For example, a Water Quality Monitoring System might focus on measuring levels of contaminants like lead or bacteria.
Next, stakeholders need to be identified. These include system owners, operators, and user communities who will rely on the data. It’s crucial to capture their needs and concerns to ensure the system meets operational interests and regulatory requirements.
Finally, create a detailed plan that outlines the processes and technologies needed for data collection, analysis, and reporting. This should include timelines, resource allocation, and performance metrics. This approach ensures the system will be both effective and efficient.
System Implementation
Once the strategy is in place, the next step is system implementation. This involves setting up the necessary hardware and software. For instance, in a Water Quality Monitoring System, this could mean installing sensors in water reservoirs and configuring data processing units.
Training personnel is vital during this phase. Staff must understand how to operate the system, troubleshoot issues, and interpret the collected data. Consistent training ensures reliable data collection and system longevity.
Additionally, setting up a robust data management system is crucial. This includes establishing protocols for data storage, security, and backup. Ensuring compliance with privacy and security standards is key, as outlined by NIST guidelines.
Regular maintenance and updates are necessary to keep the system functioning optimally. Scheduling routine checks and integrating new technologies can help in adapting to changing monitoring needs.
Data Collection Methods
Effective data collection is essential for accurate monitoring. Using the right tools and techniques ensures reliable results, especially in specialized fields like environmental sciences.
In-Situ Measurements
In-situ measurements are taken directly at the location being studied. This method is particularly useful for monitoring environmental parameters such as water quality.
Water Quality Monitoring Equipment includes sensors that measure pH, temperature, dissolved oxygen, and turbidity. These tools provide real-time data, enabling immediate analysis and response.
Field instruments need to be robust to withstand various environmental conditions. Using such equipment ensures the data collected is current and reflective of actual conditions, making it invaluable for timely decision-making.
Data Management and Analysis
Effective data management and analysis are critical for ensuring accurate and reliable results. This section covers data logging, quality assurance, and data interpretation.
Data Logging
Data logging involves systematically recording data from various sources. This process is essential for maintaining accurate and reliable records. Automated systems are frequently used to minimize human error and increase efficiency. These systems can include databases, cloud storage, or local servers where data is continuously collected and updated.
Ensuring timestamp accuracy and source identification are key aspects. Detailed logs help in tracking changes and understanding the data flow. The use of standardized formats, such as CSV or JSON, ensures consistency and facilitates easier data sharing among team members.
Quality Assurance
Quality assurance (QA) ensures that all data collected meets predefined standards. It involves regular checks and audits to maintain data integrity. Processes such as data validation, cleansing, and verification are crucial. These steps help in identifying and correcting errors before they affect results.
QA activities often include routine inspections, peer reviews, and the use of control samples. Implementing automated software tools can enhance efficiency and accuracy in QA processes. Consistent training and adherence to protocols are vital for maintaining high standards.
Data Interpretation
Data interpretation involves analyzing logged and verified data to extract meaningful insights. This step requires a deep understanding of statistical methods and tools. Analysts often use software such as SPSS, R, or Python for statistical analysis and visualization.
Graphs, charts, and tables help in presenting data in an easily understandable format. Identifying trends, patterns, and anomalies is crucial for drawing accurate conclusions. Clear documentation of methods and findings ensures transparency and reproducibility of the results. Properly interpreted data supports informed decision-making and strategic planning.
Field Notes
The practical difference between a monitoring program that works and one that generates unusable data usually comes down to calibration discipline, installation detail, and whether anyone acts on the readings. The notes below reflect recurring issues encountered during commissioning and routine operation.
Installation Considerations by Instrument Type
Most instrument failures traced back to installation rather than the instrument itself. Magnetic flow meters require a full pipe and adequate upstream straight run — commonly five pipe diameters upstream and two downstream, though manufacturer requirements vary — and a partially full pipe produces readings that look plausible and are entirely wrong. Turbidity meters are sensitive to bubble entrainment and stray light, so sample line design and sensor orientation matter more than the instrument’s stated accuracy. pH and ORP electrodes installed in a dead leg will read the stagnant pocket rather than the process. Optical DO sensors are far more tolerant of low flow than membrane types, which is the main reason they have displaced membrane sensors in aeration basins.
Common Specification Mistakes
The most frequent error is specifying instrument accuracy without specifying calibration frequency and the standards traceability that supports it. A ±0.1 pH unit instrument calibrated quarterly on expired buffers is less accurate than a ±0.2 unit instrument calibrated weekly against fresh NIST-traceable standards. The second common mistake is failing to specify communication protocol and register mapping, which turns a straightforward instrument replacement into an integration project. A third is designing a monitoring program around parameters that are easy to measure rather than parameters that drive decisions — a plant with twelve continuous analyzers and no defined response to any of their alarms has purchased instrumentation, not monitoring.
Pro Tip: Build a verification routine that is independent of the instrument being verified. Once a week, take a grab sample at the analyzer sample point and run it on a portable meter or test kit, then log both readings side by side. Drift shows up in the divergence between the two long before it shows up as an out-of-range alarm, and the paired record is exactly the evidence a regulator or an auditor asks for when a compliance reading is questioned. This takes an operator ten minutes and has prevented more reporting violations than any single piece of hardware.
Common Mistake: Treating a continuous analyzer reading as a compliance value when the permit specifies an approved laboratory method. Continuous instruments are process control and early warning tools; unless the specific instrument and method are approved under the applicable regulation, the reported compliance value must come from the approved method. Plants that blur this distinction discover the problem during an audit, not during operation — and the remedy is retroactive resampling that cannot be performed on water that has already been discharged.
Operations and Maintenance
Maintenance burden varies enormously across instrument classes, and monitoring program budgets routinely underestimate it. Electrochemical sensors — pH, ORP, chlorine — need cleaning and calibration on a weekly to monthly cycle and electrode replacement every one to two years. Optical sensors need lens cleaning but hold calibration far longer. Reagent-based analyzers such as colorimetric ammonia or phosphate units consume consumables continuously and require reagent replacement on a fixed schedule regardless of how much analysis they perform. Flow meters need little routine attention but should be verified against an independent method annually. A defensible rule of thumb is to budget annual instrument maintenance at 10 to 15 percent of installed cost, and to staff for it before the instruments arrive.
Risk Assessment in Water Quality
Risk assessment in water quality involves identifying potential contaminants, analyzing exposure levels, and assessing the health impacts of these contaminants. This comprehensive approach ensures the safety of drinking water by evaluating and managing risks.
Identifying Contaminants
Identifying contaminants is the first step in a water quality risk assessment. This involves testing water samples for harmful substances such as lead, pesticides, bacteria, and industrial chemicals. Regulatory agencies, like the EPA, set guidelines and standards for acceptable levels of these contaminants.
Regular monitoring helps detect any contaminants before they reach dangerous levels. Water systems often use advanced testing methods to provide accurate and reliable data about the presence of these substances. These tests help in understanding what contaminants are in the water and their potential sources.
Exposure Analysis
Exposure analysis evaluates how much of each contaminant people are exposed to through their drinking water. This involves assessing how often and how much water individuals consume and the concentration of contaminants in that water. Factors such as age, health status, and lifestyle can influence exposure levels.
By using this information, authorities can determine whether the exposure levels are within safe limits. According to the Risk Assessment Methodology, criticality weights are assigned to various indicators to prioritize which contaminants need immediate attention.
Health Impact Assessment
Health impact assessment looks at the potential effects of contaminants on human health. This involves studying data from scientific research and epidemiological studies to understand how exposure to specific contaminants can result in health problems. Some contaminants, like lead, can cause severe issues even at low levels.
Researchers and public health officials use models to predict health outcomes based on exposure data. The goal is to minimize health risks by setting regulatory limits and advising the public on safe practices. Implementing safety measures helps protect public health, ensuring that water quality meets the standards set by regulatory bodies like the EPA.
Case Studies in Monitoring
Monitoring is crucial in diverse fields such as urban water systems, rural and agricultural watersheds, and industrial effluent analysis. Each area presents unique challenges and uses specific strategies and technologies to ensure safety and compliance.
Urban Water Systems
In urban areas, monitoring water systems focuses on ensuring the supply and quality of drinking water. These systems use real-time sensors, which measure chemical contaminants and microbial content. Regular testing and manual sampling also help identify any issues.
Smart grids have been integrated to detect leaks and pressure changes. This innovative technology reduces water loss and ensures efficient distribution. Public health departments continuously analyze data to prevent potential outbreaks of waterborne diseases.
Government agencies like the EPA set standards and regulations for these systems, ensuring public health and environmental protection. Utilities implementing distribution system monitoring typically work from the EPA’s Revised Total Coliform Rule sampling requirements and their state primacy agency’s monitoring plan guidance.
Rural and Agricultural Watersheds
Rural and agricultural areas rely on different monitoring techniques due to their unique environmental conditions. Runoff containing pesticides and fertilizers from farmlands can contaminate nearby water bodies. The use of automatic samplers and remote sensing technology helps detect pollutants.
Farmers and local authorities work together to manage and monitor water quality. They frequently perform tests to measure levels of nitrogen, phosphorus, and other chemicals. These efforts help maintain the health of aquatic ecosystems and ensure safe water for crops and livestock.
Community-based programs also educate farmers on best practices for reducing runoff and protecting watersheds. Watershed monitoring plans in the United States are commonly developed under the framework of Clean Water Act Section 319 nonpoint source management program guidance.
Industrial Effluent Analysis
Industries discharge wastewater that must be carefully monitored to prevent environmental damage. Regular sampling and continuous monitoring of effluent are essential. pH, temperature, and chemical oxygen demand (COD) are some of the key parameters analyzed.
Automated monitoring systems are often implemented to detect and control pollutant levels in real-time. These systems alert operators to any deviations, allowing for immediate corrective actions.
Industries are required to comply with stringent regulations set by authorities like the EPA. Detailed records and reports are maintained to demonstrate compliance and address any violations promptly. Because monitoring requirements are derived directly from discharge limits, industrial programs cannot be designed without first understanding the applicable effluent standards — the permit defines which parameters are measured, at what frequency, by which approved method, and against what numeric limit.
Regulatory Frameworks and Compliance
Monitoring water quality is crucial for ensuring public health and environmental safety. Various national and international frameworks guide organizations and governments.
National Standards
In the U.S., water quality monitoring is regulated by agencies like the Environmental Protection Agency (EPA). The Safe Drinking Water Act (SDWA) sets standards for drinking water quality and oversees the states, localities, and water suppliers who implement these standards. The Clean Water Act (CWA) governs the discharge of pollutants into U.S. waters. Compliance with CWA requires regular monitoring and reporting.
Agencies use the National Primary Drinking Water Regulations (NPDWRs) to set mandatory water quality standards. These standards are enforceable and protect against health risks. National policies ensure that water supplies are safe by setting limits on contaminants and requiring treatments to remove harmful substances.
International Guidelines
Globally, organizations like the World Health Organization (WHO) provide guidelines for water quality. The WHO’s Guidelines for Drinking-water Quality (GDWQ) are widely used as a framework to establish standards and regulations. These guidelines offer criteria for microbial, chemical, and radiological quality of drinking water.
The International Organization for Standardization (ISO) also plays a significant role. ISO 14000 focuses on environmental management systems, including water quality. These standards help harmonize water quality practices across nations, ensuring consistency and reliability. By adhering to ISO standards, organizations improve their environmental performance, maintain compliance, and enhance sustainability.
Design Details and Standards
Monitoring program design is constrained by method approval as much as by engineering preference. A parameter measured by a method not approved for the applicable regulation produces data that has operational value but no compliance standing, and that distinction should be settled at the design stage rather than discovered during an inspection.
Method Selection and Traceability
Every reported value should trace back to a documented method, a calibrated instrument, and a certified standard. In practice this means maintaining current method references for each regulated parameter, retaining calibration certificates for reference standards, logging every calibration event with the standard lot number and the as-found and as-left readings, and defining acceptance criteria that trigger investigation when a calibration drifts beyond tolerance.
Applicable Standards and References
Analytical and monitoring practice in water and wastewater draws on Standard Methods for the Examination of Water and Wastewater, jointly published by APHA, AWWA, and WEF, as the primary methods reference; 40 CFR Part 136 for analytical methods approved for Clean Water Act compliance monitoring; 40 CFR Parts 141 and 143 for drinking water monitoring requirements under the Safe Drinking Water Act; the ISO 5667 series for water sampling practice; ISO 7027 for nephelometric turbidity measurement; and ISA and IEC instrumentation standards for signal transmission and control system integration. Calibration standards should be NIST-traceable, and laboratory analyses supporting compliance reporting should be performed by a certified laboratory under the applicable state program.
Monitoring Program Specification Checklist
- Parameter list, with each parameter tied to a specific regulatory driver or operational decision
- Required measurement frequency and sampling mode (grab, time-proportional, or flow-proportional composite) per the applicable permit
- Approved analytical method for each compliance parameter, with method detection limit below the applicable limit
- Instrument selection with accuracy, range, and response time stated at process conditions, not catalog conditions
- Installation requirements — straight run, sample line design, orientation, and access for service
- Calibration schedule, standards traceability, and as-found/as-left recording protocol
- Independent verification routine using a second, dissimilar measurement method
- Communication protocol, register map, and historian tag list for every instrument
- Alarm setpoints paired with a written operator response for each alarm
- Data retention period, backup strategy, and access controls meeting applicable recordkeeping requirements
- Annual maintenance budget and staffing plan sized to the installed instrument count
Stakeholder Engagement and Communication
Effective monitoring relies on strong stakeholder engagement and clear communication strategies. This ensures that all parties are informed and involved in the process.
Community Involvement
Engaging with the community is essential for successful monitoring efforts. It helps build trust and ensures that the needs of the community are met. Stakeholders should be invited to participate in meetings, workshops, and discussions. Their input can provide valuable insights that may not be obvious to experts.
Methods to enhance community involvement include public forums, surveys, and open houses. Transparency in operations and decisions further builds community trust. Regular updates through newsletters or social media can keep the community informed and engaged.
Reporting and Transparency
Transparency in reporting is key to maintaining trust with stakeholders. Clear and honest communication about findings, actions, and outcomes is critical. Regular reports should be made available to all stakeholders, detailing both successes and areas needing improvement.
Creating straightforward, easy-to-understand reports is important. Using charts, tables, and bullet points can make complex information more accessible. Additionally, holding press briefings or releasing public statements can keep everyone informed and ensure accountability. Providing access to these reports through online platforms can enhance reach and convenience for stakeholders.
Future Trends in Monitoring
The future of monitoring is set to be transformed by advancements in technology and the integration of predictive modeling and AI, leading to more efficient and accurate systems. These innovations will have a significant impact on areas such as water quality monitoring systems, among others.
Advancements in Technology
Technological advancements will revolutionize monitoring systems. Innovations in sensors will allow for the detection of contaminants at lower thresholds, enhancing water quality monitoring.
The Internet of Things (IoT) will connect various monitoring devices, enabling real-time data collection and analysis. This will provide instant insights and quicker response times.
Additionally, the development of portable monitoring equipment will make it easier to conduct on-site tests, reducing the need for samples to be sent to labs. This portability ensures immediate results and better decision-making.
Predictive Modeling and AI
The integration of predictive modeling and AI will enhance the accuracy and efficiency of monitoring systems. AI algorithms can analyze large datasets to predict potential issues before they arise.
For water quality monitoring systems, AI can forecast contamination events based on historical data and environmental conditions.
Predictive modeling tools will allow for scenario analysis, helping stakeholders prepare for future challenges. With AI, ongoing monitoring will become more proactive rather than reactive, allowing for timely interventions.
Moreover, AI can optimize resource allocation by identifying areas that need more attention, thus ensuring that monitoring efforts are both effective and cost-efficient.
Frequently Asked Questions
Monitoring plays a crucial role in various management processes, SolarEdge systems, and project management. It also helps achieve objectives in evaluation activities and is applied in different contexts.
How is monitoring utilized in management processes?
Monitoring in management processes helps track the progress of projects and ensures that they meet their goals. It involves setting performance standards, measuring actual performance, and taking corrective actions if necessary.
What is the role of monitoring within a SolarEdge system?
In a SolarEdge system, monitoring tracks the performance of solar panels and the overall system. This ensures optimal energy production and identifies issues quickly. It can be accessed remotely, providing real-time updates on energy generation.
What are the primary objectives of undertaking monitoring and evaluation activities?
The primary objectives include assessing the efficiency, effectiveness, and impact of projects. This helps in making informed decisions, improving future projects, and ensuring accountability. It also provides valuable insights into whether goals are being met.
In what contexts are various types of monitoring applied?
Different types of monitoring are applied in contexts like environmental studies, healthcare, education, and business. For instance, environmental monitoring tracks pollution levels, while in healthcare, it checks patient health metrics.
Can you describe the general framework involved in a monitoring system?
A monitoring system generally includes defining metrics, collecting data, analyzing results, and reporting findings. It often involves technology for data collection and software for analysis, ensuring accurate and timely information.
How can monitoring contribute to the effectiveness of project management?
Monitoring contributes to project management by providing continuous oversight and feedback. It helps identify risks and issues early, ensures resources are used efficiently, and keeps the project on track to meet its deadlines and objectives.
Key Takeaways
- Calibration discipline outranks instrument accuracy — a modest instrument calibrated weekly against traceable standards outperforms a premium instrument calibrated quarterly against expired buffers.
- Match the measurement to the decision — continuous analyzers are for process control and early warning; approved laboratory methods are for compliance reporting, and confusing the two creates audit exposure.
- Installation detail causes most bad data — full pipe and straight run for flow meters, bubble-free sample lines for turbidity, live flow past electrodes, and service access for everything.
- Verify independently — a weekly paired grab sample run on a portable meter catches drift long before an alarm does and creates the record regulators ask for.
- Budget for maintenance before purchase — 10 to 15 percent of installed cost annually, with staffing to match, or the instruments will be out of service within two years.
- Emerging sensing deserves tracking, not commitment — microfluidic, quantum dot, and Raman-based techniques show excellent laboratory detection limits but limited sustained field performance data.
- Every alarm needs a written response — instrumentation without a defined operator action is data collection, not monitoring.
Conclusion
Water quality monitoring spans a wide range of instrumentation, sampling practice, and analytical method, and no single approach covers the full span of parameters, response times, and detection limits a utility needs. Continuous sensors and analyzers drive process control and energy optimization; flow instrumentation underpins mass balance, permit reporting, and loss detection; sampling and laboratory analysis supply the defensible compliance values; and emerging optical and microfluidic techniques point toward detection limits that conventional instrumentation cannot reach. A well-designed program draws from several of these clusters deliberately rather than accumulating instruments over time.
The practical framework is consistent regardless of plant size: define the decisions the data must support, select methods that are approved for the applicable regulation, specify installation and calibration as rigorously as the instrument itself, verify continuously against an independent method, and pair every alarm with a written operator response. Programs built in that order produce data people trust and act on. Programs built around whichever instruments were available at budget time tend to produce historians nobody queries.