Oregon Wastewater Treatment Plants
- Introduction
- Recent Developments
- Top 20 Largest Treatment Plants
- Approved Budgets & Expansion Projects
- Regulatory & Compliance Landscape
- Technology Trends
- Directory of Facilities
- FAQ
Introduction
Oregon’s wastewater infrastructure represents a critical intersection of environmental stewardship and engineering resilience. Serving a population of approximately 4.2 million residents, the state’s network comprises over 250 permitted wastewater treatment facilities, ranging from massive regional reclamation plants in the Portland metro area to smaller lagoon systems in rural eastern counties. The state’s infrastructure is currently navigating a complex transition period defined by stringent nutrient regulations, seismic resilience requirements, and rapid population growth in the Willamette Valley and Central Oregon.
The Oregon Department of Environmental Quality (DEQ) enforces some of the strictest water quality standards in the nation, particularly regarding temperature and nutrient loading (TMDLs) in the Willamette Basin. Currently, the state has a total treatment capacity exceeding 600 MGD (Million Gallons per Day). However, aging infrastructure—much of it constructed in the 1970s under the original Clean Water Act—combined with the threat of the Cascadia Subduction Zone earthquake, has triggered a capital improvement boom. Municipalities are leveraging State Revolving Funds (SRF) and federal WIFIA loans to modernize facilities, aiming to transform traditional treatment plants into resource recovery centers.
Recent Developments & Projects
In the last 24 months, Oregon has seen a significant shift toward large-scale capital improvement plans (CIPs) focused on two primary drivers: wet weather capacity management and seismic retrofitting. The City of Portland is midway through a multi-decade effort to virtually eliminate Combined Sewer Overflows (CSOs), while Clean Water Services (Washington County) continues to pioneer water reuse and nutrient recovery technologies.
Currently, over $1.5 billion in major wastewater infrastructure projects are active across the state. The Infrastructure Investment and Jobs Act (IIJA) has bolstered the state’s Clean Water State Revolving Fund, allowing for accelerated project timelines. Notable trends include:
- Thermal Load Trading: Innovative compliance strategies where utilities plant trees and restore riparian zones to offset effluent temperature, rather than installing energy-intensive mechanical chillers.
- Renewable Natural Gas (RNG): Major facilities like the Columbia Boulevard Wastewater Treatment Plant are upgrading digesters to convert biogas into vehicle fuel, reducing carbon footprints and generating revenue.
- Seismic Resilience: Coastal communities and Willamette Valley plants are heavily investing in geotechnical ground improvements and flexible piping systems to withstand a magnitude 9.0 earthquake event.
Top 20 Largest Treatment Plants
The following ranking is based on Wet Weather Design Capacity (MGD). Note that in Oregon, particularly in the Willamette Valley, wet weather flows can be 3-5 times higher than dry weather flows due to infiltration and inflow (I&I) and combined sewer systems.
| Rank | Plant Name | City/Location | Design Capacity (Peak MGD) | Population Served | Operating Authority |
|---|---|---|---|---|---|
| 1 | Columbia Boulevard WWTP | Portland | 450 MGD | 650,000 | City of Portland Bureau of Environmental Services |
| 2 | Durham Advanced Wastewater Treatment Facility | Tigard | 100 MGD | 260,000 | Clean Water Services |
| 3 | Rock Creek Advanced Wastewater Treatment Facility | Hillsboro | 100 MGD | 240,000 | Clean Water Services |
| 4 | Willow Lake Water Pollution Control Facility | Salem | 105 MGD | 195,000 | City of Salem |
| 5 | Eugene-Springfield Water Pollution Control Facility | Eugene | 277 MGD (Peak) | 240,000 | Metro Wastewater Management Commission (MWMC) |
| 6 | Tryon Creek WWTP | Portland/Lake Oswego | 37.5 MGD | 80,000 | City of Portland BES |
| 7 | Gresham WWTP | Gresham | 20 MGD (avg) / 60 Peak | 115,000 | City of Gresham |
| 8 | Medford Regional Water Reclamation Facility | Medford | 45 MGD | 135,000 | City of Medford |
| 9 | Corvallis Water Reclamation Facility | Corvallis | 48 MGD | 58,000 | City of Corvallis |
| 10 | Water Environment Services (Tri-City) | Oregon City | 45 MGD | 95,000 | Clackamas County WES |
| 11 | Bend Water Reclamation Facility | Bend | 12.5 MGD (Avg) | 100,000 | City of Bend |
| 12 | Albany Water Reclamation Facility | Albany | 29 MGD | 55,000 | City of Albany |
| 13 | Kellogg Creek Water Resource Recovery Facility | Milwaukie | 25 MGD | 70,000 | Clackamas County WES |
| 14 | Grants Pass Water Restoration Plant | Grants Pass | 18 MGD | 38,000 | City of Grants Pass |
| 15 | Klamath Falls Spring Street WWTP | Klamath Falls | 14 MGD | 40,000 | City of Klamath Falls |
| 16 | Roseburg Regional Water Reclamation Facility | Roseburg | 12 MGD | 35,000 | City of Roseburg |
| 17 | McMinnville Water Reclamation Facility | McMinnville | 12 MGD | 34,000 | City of McMinnville |
| 18 | Wilsonville WRRF | Wilsonville | 10 MGD | 25,000 | City of Wilsonville |
| 19 | Forest Grove WWTP | Forest Grove | 8 MGD | 25,000 | Clean Water Services |
| 20 | Woodburn WWTP | Woodburn | 7.5 MGD | 26,000 | City of Woodburn |
Top 5 Plant Profiles
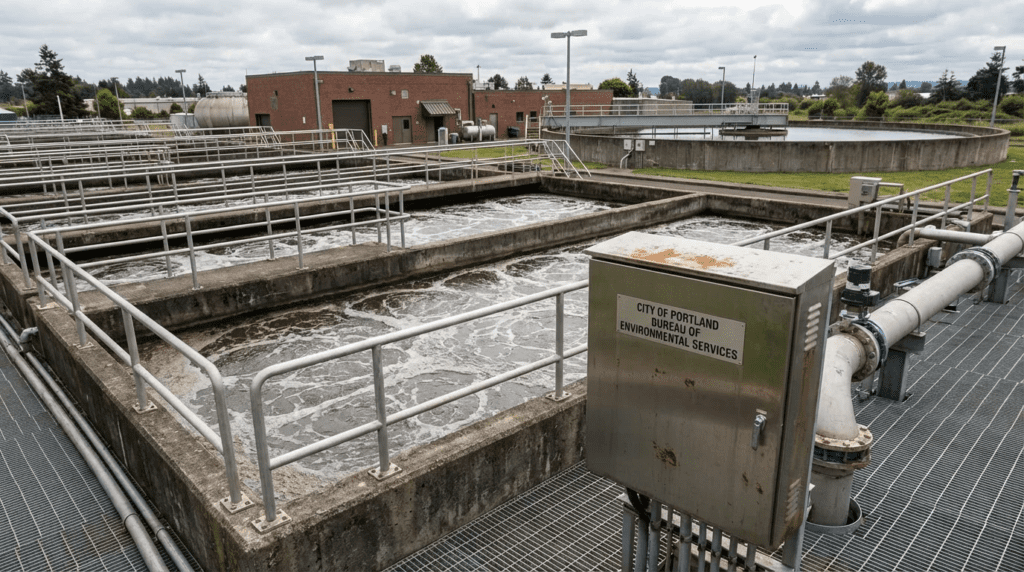
1. Columbia Boulevard Wastewater Treatment Plant (CBWTP)
- Location: Portland, Multnomah County
- Design Capacity: 110 MGD (Dry) / 450 MGD (Wet Peak)
- Population Served: 650,000+ residents
- Operating Authority: Portland Bureau of Environmental Services
- Receiving Water: Columbia River
Treatment Process: The CBWTP employs preliminary screening, primary clarification, and secondary treatment via activated sludge. Disinfection is achieved through sodium hypochlorite. The plant is notable for its massive wet weather capacity designed to handle combined sewer flows.
Infrastructure Highlights: The facility recently completed a major Biogas Utilization project, converting methane from anaerobic digesters into Renewable Natural Gas (RNG) for the vehicle market. It features extensive odor control systems due to its proximity to industrial and residential zones.
Key Compliance: Operating under a strict NPDES permit focused on reducing mercury and toxins entering the Columbia River.
2. Durham Advanced Wastewater Treatment Facility
- Location: Tigard, Washington County
- Design Capacity: 26 MGD (Avg) / 100 MGD (Peak)
- Population Served: ~260,000 residents
- Operating Authority: Clean Water Services
- Receiving Water: Tualatin River
Treatment Process: Advanced tertiary treatment including biological nutrient removal (BNR), chemical phosphorus removal, and sand filtration. It produces Class A reuse water for irrigation.
Infrastructure Highlights: Features the Ostara Pearl® process for recovering phosphorus from wastewater to create slow-release fertilizer. The plant is a leader in energy self-sufficiency through cogeneration engines.
3. Rock Creek Advanced Wastewater Treatment Facility
- Location: Hillsboro, Washington County
- Design Capacity: 39 MGD (Avg) / 100 MGD (Peak)
- Population Served: ~240,000 residents
- Operating Authority: Clean Water Services
- Receiving Water: Tualatin River
Treatment Process: Similar to Durham, Rock Creek utilizes advanced biological treatment and tertiary filtration. It is currently undergoing significant expansion to handle industrial loads from the “Silicon Forest” semiconductor industry.
Recent Upgrades: A massive primary clarifier rehabilitation and the installation of new aeration blowers for energy efficiency.
4. Willow Lake Water Pollution Control Facility
- Location: Salem, Marion County
- Design Capacity: 105 MGD (Peak)
- Population Served: 195,000 residents
- Operating Authority: City of Salem
- Receiving Water: Willamette River
Treatment Process: Trickling filters followed by activated sludge (coupled process). The facility generates Class A biosolids using a specialized heat drying process.
Infrastructure: The Cogeneration Power Facility produces approximately 650 kW of electricity using biogas, offsetting a significant portion of plant energy needs.
5. Eugene-Springfield Water Pollution Control Facility
- Location: Eugene, Lane County
- Design Capacity: 277 MGD (Peak Hydraulic)
- Population Served: 240,000 residents
- Operating Authority: Metro Wastewater Management Commission (MWMC)
- Receiving Water: Willamette River
Treatment Process: Activated sludge with seasonal disinfection. The plant manages distinct wet weather challenges and uses a biocycle farm for biosolids application.
Recent Upgrades: Currently implementing a major “Resiliency Project” to upgrade electrical distribution and backup power to ensure operation during seismic events.
Plants with Approved Budgets & Expansion Projects
Oregon utilities are in a heavy construction cycle. Below are the definitive projects driving the engineering and construction market.
A. Major Projects Under Construction (2024-2026)
Portland CBWTP – Secondary Treatment Expansion Program (STEP)
- Location: Portland, OR
- Project Scope: The largest project in BES history. Includes construction of two new secondary clarifiers, seismic upgrades to existing infrastructure, and modification of the aeration basins.
- Total Budget: $585 Million
- Funding: WIFIA Loan ($727M approved for broader BES projects), Revenue Bonds
- Timeline: Construction active; completion expected 2024/2025.
- Key Contractors: Kiewit (CM/GC), Brown and Caldwell (Design).
- Drivers: Increasing treatment capacity to handle peak flows and ensuring seismic resilience for the main treatment plant serving Portland.
Tri-City Water Resource Recovery Facility – Solids Handling Improvement
- Location: Oregon City, OR
- Project Scope: Expansion of solids handling capacity including new anaerobic digesters and solids dewatering equipment.
- Total Budget: ~$90 Million
- Funding: SRF Loans, Local Capital Funds
- Timeline: Construction ongoing, completion 2025.
- Drivers: Population growth in Clackamas County and aging solids infrastructure.
Bend North Interceptor & Septic to Sewer Program
- Location: Bend, OR
- Project Scope: While largely conveyance, this project impacts the Water Reclamation Facility by redirecting massive flows and retiring septic systems. Includes capacity upgrades at the headworks.
- Total Budget: $40 Million+
- Timeline: Phased construction through 2026.
- Drivers: Rapid housing development and groundwater protection.
B. Projects in Design/Planning Phase (2025-2027)
- Clean Water Services Rock Creek Upgrades: Multi-year CIP allocated $60M+ for industrial waste improvements and primary treatment rehabilitation to support semiconductor expansion in Hillsboro.
- Albany Water Reclamation Facility Improvements: $80M planned for wet weather capacity improvements and composting facility upgrades. Currently in pre-design/permitting.
- Corvallis WRF Master Plan Projects: $45M earmarked for secondary treatment redundancy and flood protection upgrades (Willamette River proximity).
Summary Statistics
- Total Active Capital Investment: ~$1.2 Billion under construction or design
- Largest Single Project: Portland STEP ($585M)
- Primary Drivers: Seismic Resiliency (40%), Capacity/Growth (30%), Nutrient Compliance (30%)
- Key Funding Sources: WIFIA Loans (Portland/Hillsboro), Oregon DEQ Clean Water SRF, Revenue Bonds
Regulatory & Compliance Landscape
Engineering in Oregon requires navigating a unique regulatory framework managed by the Oregon Department of Environmental Quality (DEQ).
- Temperature TMDLs: The most significant challenge for Oregon plants. The Willamette and Columbia Rivers have strict temperature limits to protect salmon and steelhead. Plants must often implement effluent cooling or purchase “thermal credits” via riparian shade tree planting programs (a model pioneered by Clean Water Services).
- Nutrients: While not as severe as the Chesapeake Bay, Oregon is tightening limits on ammonia and phosphorus, driving the adoption of Biological Nutrient Removal (BNR) and membrane bioreactor (MBR) technologies.
- Seismic Standards: The Oregon Resilience Plan requires critical infrastructure (including WWTPs) to remain operational after a Cascadia Subduction Zone event. This dictates the design of all new tanks, piping, and control buildings.
Technology Trends in Oregon
Oregon is often an early adopter of sustainable treatment technologies:
- Resource Recovery: High adoption of struvite recovery (fertilizer production) and Class A biosolids production for land application.
- Co-Digestion & RNG: Utilities are accepting fats, oils, and grease (FOG) to boost biogas production for Renewable Natural Gas injection (Portland, Salem, Gresham).
- Net-Zero Energy: The Gresham WWTP was the first in the Pacific Northwest to achieve energy net-zero status through solar arrays and cogeneration.
Complete Directory of Facilities
Browse our directory of water and wastewater treatment plants in Oregon (Segmented by Size):
Major Regional Facilities (>20 MGD)
- Columbia Boulevard WWTP (Portland)
- Durham Advanced Wastewater Treatment Facility (CWS)
- Rock Creek Advanced Wastewater Treatment Facility (CWS)
- Willow Lake WPCF (Salem)
- Eugene-Springfield WPCF
- Tri-City WRRF (Clackamas)
Municipal Plants (5-20 MGD)
- Bend Water Reclamation Facility
- Gresham WWTP
- Albany Water Reclamation Facility
- Medford Regional WRF
- Klamath Falls Spring Street WWTP
- Roseburg Regional WRF
FAQ
What is the largest wastewater treatment plant in Oregon?
The Columbia Boulevard Wastewater Treatment Plant in Portland is the largest, with a wet weather peak design capacity of 450 MGD and a dry weather flow of approximately 80 MGD.
What are the thermal trading programs in Oregon wastewater compliance?
Thermal trading allows utilities to meet temperature discharge permits by restoring riverbanks and planting trees to shade the water (cooling it naturally) rather than installing mechanical chillers. Clean Water Services and the City of Medford have pioneered these programs.
Which Oregon plants are currently undergoing major expansion?
The City of Portland (STEP project), Clean Water Services (Rock Creek), and the City of Bend (North Interceptor/Headworks) are all in the midst of major multi-million dollar capital improvement phases.
How is Oregon funding wastewater infrastructure?
Funding primarily comes from the Oregon DEQ Clean Water State Revolving Fund (SRF), EPA WIFIA loans (notably for Portland and Hillsboro), and municipal revenue bonds supported by utility rate payers.