Wastewater Treatment Process Parameters: TSS BOD MLSS Guide
1) INTRODUCTION
In municipal and industrial biological treatment facilities, operating entirely on “operator intuition” is a guaranteed path to compliance violations, wasted energy, and biological upsets. A critical specification mistake engineers frequently make during plant upgrades is separating process design from the instrumentation meant to control it. To maintain process stability and regulatory compliance, engineers rely heavily on a fundamental Wastewater Treatment Process Parameters: TSS BOD MLSS Guide.
This comprehensive Wastewater Treatment Process Parameters: TSS BOD MLSS Guide encompasses a vast landscape of biological metrics, physical settling characteristics, and the advanced monitoring equipment required to track them. Understanding how Biochemical Oxygen Demand (BOD) dictates aeration requirements, or how Mixed Liquor Suspended Solids (MLSS) affects clarifier solids loading, is foundational to activated sludge design. This pillar page systematically breaks down every major parameter, control methodology, and instrumentation subtype, detailing their applications, advantages, limitations, and operational impacts so that public works decision-makers, plant directors, and design engineers can properly size systems and specify analytical equipment.
2) SUBCATEGORY LANDSCAPE — TYPES, TECHNOLOGIES & APPROACHES
The landscape of this Wastewater Treatment Process Parameters: TSS BOD MLSS Guide is divided into core biological metrics, operational control limits, online monitoring instrumentation, and automated process approaches. Navigating this landscape requires understanding that parameters like BOD and TSS dictate the mass balance of the plant, while metrics like SRT and F/M ratio give operators the levers to manipulate that balance. The following subsections detail the essential branches of wastewater process parameter tracking and control.
Fundamental Laboratory & Process Parameters
Total Suspended Solids (TSS) Analysis is the standard gravimetric measurement of particulate matter retained by a glass-fiber filter (typically 1.5-micron) and dried to a constant weight at 103-105°C. This parameter is used universally to measure raw influent solids loading, primary clarifier efficiency, and final effluent compliance. Its primary limitation is that it does not differentiate between inert inorganic grit and volatile organic matter. Engineers specify strict effluent TSS limits (typically < 10 to 30 mg/L) because high TSS strongly correlates with high effluent BOD and can shield pathogens during UV or chemical disinfection processes.
Biochemical Oxygen Demand (BOD5) Testing measures the amount of dissolved oxygen consumed by microorganisms over five days at 20°C while stabilizing organic matter. It remains the gold standard regulatory parameter for evaluating the organic strength of influent wastewater and verifying treatment efficiency. Because the 5-day incubation period renders it useless for real-time process control, it is strictly a historical compliance and design metric. Municipal influent typically ranges from 150-300 mg/L BOD5, while industrial applications (like food processing) can see values exceeding 3,000 mg/L, requiring significant aeration system sizing considerations.
Chemical Oxygen Demand (COD) Monitoring provides a much faster (typically 2-hour) chemical oxidation measurement of organics using a strong acid and an oxidizing agent (like potassium dichromate). COD encompasses both biodegradable and non-biodegradable organics, making the COD value inherently higher than the BOD5 value. Operators use COD as an immediate proxy for BOD by establishing a plant-specific BOD:COD ratio (typically 0.4 to 0.8 for municipal wastewater). This allows for rapid response to sudden toxic shock loads or organic spikes that would otherwise decimate the biological reactor.
Mixed Liquor Suspended Solids (MLSS) Control represents the total inventory of biomass and inert solids circulating within the aeration basin. It is the core metric for sizing the biological reactor volume. Conventional Activated Sludge (CAS) plants typically operate between 1,500 and 3,000 mg/L, while Membrane Bioreactors (MBRs) can sustain incredibly dense MLSS concentrations of 8,000 to 12,000 mg/L. Controlling MLSS is critical: running too high wastes blower energy and risks clarifier solids washout, while running too low risks biological wash-out and failure to achieve nitrification.
Mixed Liquor Volatile Suspended Solids (MLVSS) Tracking takes MLSS a step further by igniting the sample at 550°C to volatilize the organic fraction, leaving only inert ash. The volatile fraction represents the “active” living microbial population doing the actual treatment work. Typically, MLVSS is 70% to 80% of the total MLSS in municipal plants. Tracking the MLVSS/MLSS ratio is vital for engineers diagnosing biological health; a sudden drop in the ratio often indicates an accumulation of inorganic silt, grit, or non-volatile industrial precipitants.
Advanced Operational & Control Parameters
Sludge Volume Index (SVI) Calculation is the metric used to quantify the settleability of activated sludge. It is calculated by measuring the 30-minute settled sludge volume (SSV) in a 1,000 mL graduated cylinder and dividing it by the MLSS concentration (in g/L). An SVI between 80 and 120 mL/g indicates excellent, fast-settling sludge. An SVI exceeding 150 mL/g warns of “bulking sludge,” often caused by filamentous bacteria overgrowth, which will lead to clarifier failure. Engineers must rely on accurate SVI data when sizing secondary clarifier surface overflow rates (SOR) and solids loading rates (SLR).
Food to Microorganism (F/M) Ratio Control defines the relationship between incoming daily organic load (Food = BOD or COD in lbs/day) and the active biomass inventory (Microorganisms = MLVSS in lbs). A typical conventional aeration process targets an F/M ratio of 0.2 to 0.5 lbs BOD/lb MLVSS/day. High F/M ratios (overfed systems) lead to rapidly growing dispersed bacteria that will not flocculate or settle properly. Low F/M ratios (starved systems) encourage filamentous bacteria and pinpoint floc. Engineers use this parameter extensively to design aeration basin volumes based on projected diurnal flow variations.
Solid Retention Time (SRT) Optimization (also known as Mean Cell Residence Time or MCRT) dictates the average number of days a microorganism remains in the treatment system before being wasted. It is the most critical operational lever for biological nutrient removal. Carbonaceous BOD removal only requires an SRT of 2-4 days, but nitrifying bacteria (which convert ammonia to nitrate) grow much slower, requiring an SRT of 8-15 days depending on wastewater temperature. Proper SRT optimization balances the need for nitrification against the massive aeration costs of maintaining old, highly endogenous sludge.
Dissolved Oxygen (DO) Profiling involves tracking the residual oxygen available to the biomass across different zones of the aeration basin. Optimal DO for carbonaceous removal and nitrification is typically 1.5 to 2.0 mg/L. Supplying too much DO (e.g., >3.0 mg/L) drastically wastes electrical power (blowers often account for 50-60% of a plant’s energy bill) and can inhibit denitrification in downstream anoxic zones. Profiling allows engineers to taper aeration geometry, concentrating diffuser density at the head of the basin where oxygen demand is highest.
Ammonia and Total Nitrogen (TN) Tracking measures the various species of nitrogen throughout the plant to ensure compliance with stringent nutrient discharge limits. Ammonia is highly toxic to aquatic life and exerts a massive oxygen demand on receiving waters. Total Nitrogen encompasses ammonia, organic nitrogen, nitrites, and nitrates. Tracking these requires specific anoxic and aerobic zone configurations, driving the specification of internal mixed liquor recycle (IMLR) pumps to facilitate total biological nutrient removal (BNR).
Total Phosphorus (TP) Measurement quantifies both dissolved orthophosphates and particulate phosphorus. Strict limits (often < 1.0 or even < 0.1 mg/L) are enforced to prevent eutrophication in receiving lakes and rivers. Tracking TP dictates whether a plant utilizes Enhanced Biological Phosphorus Removal (EBPR) utilizing anaerobic selector zones, or relies on chemical precipitation using ferric chloride or alum. Frequent TP measurement is crucial to optimize chemical dosing and prevent excess sludge generation from over-dosing coagulants.
Instrumentation & Sensor Technologies
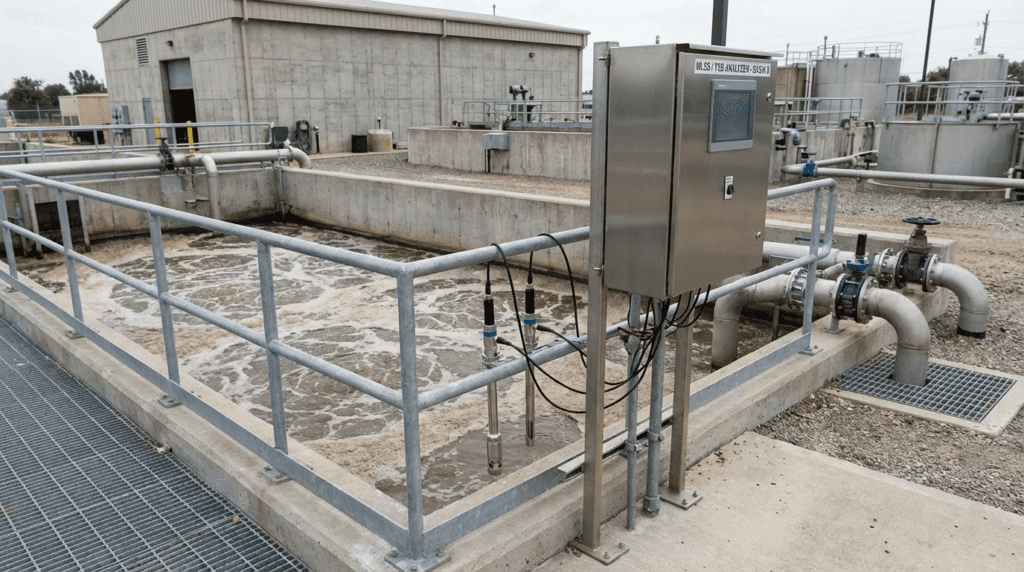
Online Optical TSS Sensors utilize near-infrared (NIR) light scattering technology—typically scattered at a 90-degree or 180-degree angle—to provide continuous, real-time MLSS and TSS data. They are mounted directly in aeration basins, clarifier influent, and effluent channels. Compared to manual gravimetric testing, they allow instantaneous automated control of wasting. However, they require frequent optical window cleaning and must be mathematically correlated to lab data to account for changing sludge color and morphology.
Microwave and Radar Sludge Density Meters measure the time-of-flight or phase shift of microwave signals passing through a sludge pipe. Unlike optical sensors, they are not impacted by pipe coating, grease, or varying flow velocities, making them ideal for high-solids applications like thickened primary sludge or anaerobic digester feed (typically 2% to 8% solids). Their high capital cost makes them prohibitive for small municipal plants, but their reliability offers exceptional payback in chemical polymer optimization for dewatering presses.
Respirometry BOD Analyzers are specialized online instruments that measure the actual respiration rate (oxygen uptake rate) of an active mixed liquor sample when mixed with influent. Instead of waiting 5 days, respirometry provides near real-time estimations of organic load and early warnings of toxic industrial influent that might poison the biomass. These are highly sophisticated, maintenance-intensive units typically reserved for large, advanced municipal plants or complex industrial chemical facilities.
Luminescent Dissolved Oxygen (LDO) Probes have largely replaced legacy electrochemical (Clark cell) DO sensors. They work by measuring the quenching effect of oxygen on a luminescent dye excited by blue light. LDO sensors require no membranes, no electrolyte solutions, and do not consume oxygen during measurement. They offer extraordinary drift-free stability, requiring calibration perhaps only once per year. They are the industry standard for controlling VFDs on aeration blowers.
Spectrophotometric UV254 Organics Monitors pass ultraviolet light at a 254 nm wavelength through a water sample. Organic compounds with double carbon bonds absorb this light. While not a direct measure of BOD or COD, UV254 provides a highly accurate, zero-reagent, instantaneous surrogate trend for organic loading. They are excellent for identifying rapid spikes in industrial influent, though they struggle with highly turbid water and require automated compressed-air or mechanical wipers to prevent biofouling.
Automated Composite Samplers are electro-mechanical devices (often refrigerated to 4°C) that pull discrete aliquots of wastewater at specified time or flow intervals over a 24-hour period. While not “sensors,” they are the regulatory backbone of process parameters. Without accurate flow-proportioned composite sampling, all laboratory BOD, TSS, and nutrient testing is rendered unrepresentative and legally invalid for Discharge Monitoring Reports (DMRs).
Automated Process Control Approaches
Wasting Rate (WAS) Automation links online MLSS sensors or calculated SRT targets to the VFDs of Waste Activated Sludge pumps. Instead of an operator manually adjusting a wasting valve once a day based on a grab sample, the PLC continuously trims the WAS pump speed to maintain a mathematically exact sludge age or mass inventory. This prevents the severe peaks and valleys in biological performance common in manually operated facilities.
Return Activated Sludge (RAS) Pacing involves controlling the rate at which settled biomass is pumped from the clarifier underflow back to the aeration basin. Modern approaches pace the RAS flow dynamically as a percentage of influent flow (typically 50% to 150%) while utilizing sludge blanket level detectors in the clarifier. This keeps the clarifier blanket optimized and ensures the aeration basin maintains a steady biological inventory during wet weather peak flow events.
Aeration Blower VFD Control utilizes a feedback loop from LDO probes in the aeration basin to a PLC, which utilizes a PID loop to modulate the speed of centrifugal or positive displacement blowers. Because oxygen transfer efficiency drops as water temperature rises and biological demand fluctuates diurnally, automated DO control prevents chronic over-aeration. This single automation approach routinely saves plants 20% to 40% on their overall electrical utility costs.
Biological Nutrient Removal (BNR) Optimization integrates multiple parameters (DO, ORP, Ammonia, Nitrate, MLSS) into an advanced predictive control algorithm. These systems automatically adjust internal mixed liquor recycle rates, carbon dosing (like methanol or glycerin), and aeration profiles to achieve total nitrogen removal. This approach is practically mandatory for facilities facing strict < 3 mg/L Total Nitrogen effluent limits, as manual control of such complex biological kinetics is virtually impossible.
3) SELECTION & SPECIFICATION FRAMEWORK
Specifying the right instrumentation and operational framework from the Wastewater Treatment Process Parameters: TSS BOD MLSS Guide requires matching plant scale, regulatory pressure, and operator skill level to the appropriate technology.
Decision Tree Logic: When to use what
- For Small Municipal Plants (< 1 MGD): Focus heavily on manual, reliable metrics. Capital budgets rarely support advanced respirometry. Rely on laboratory Biochemical Oxygen Demand (BOD5) Testing for compliance, and use daily grab samples for Sludge Volume Index (SVI) Calculation. Instrumentation should be limited to rugged, low-maintenance Luminescent Dissolved Oxygen (LDO) Probes to automate aeration and save energy.
- For Medium to Large BNR Plants (1-20 MGD): Stricter nutrient limits require tighter SRT control. Transition to Solid Retention Time (SRT) Optimization strategies utilizing Online Optical TSS Sensors. Ammonia and Total Nitrogen (TN) Tracking becomes critical for optimizing internal recycle flows and sizing anoxic zones.
- For High-Strength Industrial Wastewater: Industrial flows are highly variable and prone to toxicity. Replace slow BOD testing with rapid Chemical Oxygen Demand (COD) Monitoring or online Spectrophotometric UV254 Organics Monitors to protect the biomass from shock loads.
Lifecycle Cost and O&M Tradeoffs
Engineers often make the specification pitfall of purchasing highly complex analyzers (like online orthophosphate or respirometers) without budgeting for the intensive OPEX. Reagents, tubing replacement, and calibration labor can cost thousands annually per analyzer. Conversely, failing to specify Aeration Blower VFD Control linked to LDO probes results in astronomical OPEX via wasted electricity. The rule of thumb: invest capital in robust inline sensors (LDO, optical TSS) and VFDs first; only move to reagent-based online analyzers when regulatory compliance absolutely demands it.
4) COMPARISON TABLES
The following tables provide an engineer-level quick reference for the major parameters and instrumentation options detailed in this guide. Table 1 maps out the analytical methods and typical limits, while Table 2 outlines the operational application matrix.
| Parameter / Technology | Measurement Method / Sensor Type | Primary Process Function | Typical Range / Target | Maintenance / Labor Profile |
|---|---|---|---|---|
| Total Suspended Solids (TSS) Analysis | Gravimetric (105°C) | Effluent compliance, primary efficiency | < 10 – 30 mg/L (Effluent) | High labor (Laboratory manual) |
| Biochemical Oxygen Demand (BOD5) Testing | Biological Respiration (5-day, 20°C) | Regulatory compliance, organic load sizing | 150 – 300 mg/L (Influent) | High labor, 5-day delay |
| Mixed Liquor Suspended Solids (MLSS) Control | Gravimetric / Online Optical | Biomass inventory, clarifier solids loading | 1,500 – 3,000 mg/L (CAS) | Low to Medium (Sensor wiping) |
| Sludge Volume Index (SVI) Calculation | 30-min Settling Volume ÷ MLSS | Clarifier settleability, bulking warning | 80 – 120 mL/g | Low (Daily manual grab test) |
| Luminescent Dissolved Oxygen (LDO) Probes | Optical luminescence quenching | Blower automation, aeration control | 1.5 – 2.0 mg/L (Aerobic zone) | Very Low (Annual cap replacement) |
| Online Optical TSS Sensors | Near-Infrared scattering | Automated WAS pacing, continuous MLSS | 0 – 10,000+ mg/L | Medium (Frequent cleaning/calibration) |
| Application Scenario | Optimal Approach / Parameter Focus | Key Constraint / Limitation | Operator Skill Impact |
|---|---|---|---|
| Small Municipal, Simple Carbon Removal | Manual Wasting Rate (WAS) Automation via gravimetric MLSS testing | Prone to daily variation if sampling is missed | Low to Moderate |
| Strict Nutrient Limits (< 3 mg/L TN) | Solid Retention Time (SRT) Optimization with continuous online MLSS/TN monitoring | Requires highly calibrated inline sensors | High (Advanced kinetics understanding) |
| High-Strength Industrial/Food Processing | Chemical Oxygen Demand (COD) Monitoring & Spectrophotometric UV254 Organics Monitors | UV254 struggles with high turbidity/fats | High (Rapid response to shocks required) |
| Thickened Sludge to Digesters | Microwave and Radar Sludge Density Meters | High initial CAPEX compared to optical | Low (Highly automated once commissioned) |
5) ENGINEER & OPERATOR FIELD NOTES
Understanding the theory behind Wastewater Treatment Process Parameters: TSS BOD MLSS Guide is only half the battle. Real-world installation, commissioning, and troubleshooting dictate the success of any process design.
When specifying aeration volumes, do not rely solely on historical average flows. Calculate your Food to Microorganism (F/M) Ratio Control under winter peak hour conditions. Cold water slows biological activity, forcing you to carry a higher MLSS inventory. If your secondary clarifier surface overflow rate wasn’t sized to handle that higher winter MLSS, your clarifier blanket will rise and wash out TSS into the effluent.
Commissioning Considerations
When commissioning Online Optical TSS Sensors, the most critical mistake operators make is failing to establish a robust site-specific correlation curve. Factory calibrations are based on standard formazin solutions. Real activated sludge reflects light differently depending on sludge age, color, and filament count. You must take at least 10 grab samples over a week, run lab gravimetric MLSS analyses, and enter these offset values into the sensor’s transmitter. For Luminescent Dissolved Oxygen (LDO) Probes, ensure they are placed in a representative, well-mixed zone of the aeration basin, avoiding direct proximity to diffuser heads where bubbles will cause artificially high readings.
Common Specification Mistakes
Engineers often confuse the requirements of Biochemical Oxygen Demand (BOD5) Testing with those of Chemical Oxygen Demand (COD) Monitoring. Specifying online COD analyzers for a municipal plant purely for compliance tracking is a massive waste of capital; regulators will still require the 5-day BOD lab test for the DMR. Conversely, relying on off-site laboratory BOD testing to protect an industrial anaerobic digester from toxic shock will result in catastrophic failure because the data arrives five days too late. Match the speed of the parameter to the speed of the process risk.
Operators frequently see poor settling in the clarifier (a high Sludge Volume Index (SVI) Calculation) and assume the bugs are dying, so they drastically increase aeration. If the bulking is caused by low F/M filamentous bacteria (like Microthrix parvicella), increasing DO does nothing. Instead, adjusting the Return Activated Sludge (RAS) Pacing or utilizing an anaerobic selector to increase the F/M ratio is the correct engineering response.
O&M and Troubleshooting Overview
- Pinpoint Floc and Turbid Effluent: Often caused by an over-extended Solid Retention Time (SRT) Optimization. The sludge is too old, endogenous respiration dominates, and the floc breaks apart. Root Cause Action: Increase the WAS rate to lower the SRT.
- High Effluent Ammonia: Indicates failure of the nitrifying bacteria. Root Cause Action: Check the Dissolved Oxygen (DO) Profiling (nitrifiers need > 1.5 mg/L), check for loss of alkalinity (nitrification consumes 7.14 mg of alkalinity per mg of ammonia oxidized), or ensure the SRT is long enough for the current water temperature.
- Sensor Drift on LDO: If an LDO probe reads erratically, it is rarely a sensor failure. Often, rags or hair have wrapped around the sensor cap, creating a localized anoxic micro-environment right on the sensor face. Routine physical cleaning is still required, even for “low-maintenance” optical tech.
6) DESIGN DETAILS & STANDARDS
Proper application of the Wastewater Treatment Process Parameters: TSS BOD MLSS Guide relies heavily on mathematical mass balances and standardized testing protocols.
Sizing Methodology Overview
Biological reactor volume (V) is fundamentally derived using the target SRT, design flow (Q), influent BOD, and the desired Mixed Liquor Suspended Solids (MLSS) Control concentration.
A simplified volume equation is: V = (SRT × Q × Y × (BOD_in – BOD_out)) / (MLVSS × (1 + (kd × SRT)))
Where Y is the biomass yield coefficient and kd is the endogenous decay coefficient. Notice how intimately Solid Retention Time (SRT) Optimization and Mixed Liquor Volatile Suspended Solids (MLVSS) Tracking dictate the physical concrete footprint of the plant. A decision to run a low MLSS (e.g., 1,500 mg/L) requires double the tank volume compared to running at 3,000 mg/L to maintain the exact same mass of active bugs.
Parameters by Process Variant
The target numbers change drastically based on the treatment technology selected:
- Conventional Activated Sludge (CAS): MLSS 1,500 – 3,000 mg/L. SVI targets < 150. Requires massive secondary clarifier footprints based on settling parameters.
- Membrane Bioreactors (MBR): MLSS 8,000 – 12,000 mg/L. Because ultrafiltration membranes provide absolute physical barriers, Sludge Volume Index (SVI) Calculation becomes irrelevant (there is no gravity settling). However, Dissolved Oxygen (DO) Profiling becomes critical because oxygen transfer efficiency plummets in thick, viscous high-MLSS sludge.
- Moving Bed Biofilm Reactors (MBBR): MLSS is not measured in the traditional sense, as the active biomass is attached to plastic media rather than suspended. Parameter tracking shifts toward biofilm thickness and bulk liquid DO.
Applicable Standards & Compliance
All laboratory testing methodologies for these parameters must strictly adhere to Standard Methods for the Examination of Water and Wastewater (published jointly by APHA, AWWA, and WEF).
Standard Method 2540D: Dictates the protocol for Total Suspended Solids (TSS) Analysis, requiring specific glass-fiber filter preparation and precision weighing.
Standard Method 5210B: Outlines the stringent dilution and seed requirements for legally valid Biochemical Oxygen Demand (BOD5) Testing.
Electrical instrumentation (like Luminescent Dissolved Oxygen (LDO) Probes and VFDs) must meet UL and NEMA 4X (or IP68 for submersible) standards for wet, corrosive wastewater environments. Equipment deployed in headworks or covered anaerobic tanks must often meet Class I, Division 1 explosion-proof (ATEX) ratings due to methane and H2S gases.
7) FAQ SECTION
What are the different types of wastewater process monitoring parameters and equipment?
The primary types encompass biological metrics like Total Suspended Solids (TSS) Analysis, Biochemical Oxygen Demand (BOD5) Testing, and Mixed Liquor Suspended Solids (MLSS) Control. Operational control types include Solid Retention Time (SRT) Optimization and Food to Microorganism (F/M) Ratio Control. To monitor these, engineers specify equipment types such as Luminescent Dissolved Oxygen (LDO) Probes, Online Optical TSS Sensors, and Spectrophotometric UV254 Organics Monitors.
How do you choose between SRT optimization and F/M ratio control?
You don’t typically choose one over the other; they are interrelated. Food to Microorganism (F/M) Ratio Control is largely a design parameter used to size the initial aeration basins based on expected organic loads. Once the plant is operational, Solid Retention Time (SRT) Optimization becomes the primary daily control strategy. Adjusting the SRT by altering the Wasting Rate (WAS) Automation directly changes the MLSS inventory, which in turn manipulates the active F/M ratio.
What is the most cost-effective aeration control method for small plants?
The most cost-effective upgrade for small plants is linking rugged Luminescent Dissolved Oxygen (LDO) Probes to Aeration Blower VFD Control. Small plants often manually run blowers at 100% capacity 24/7. Automating the DO to a tight 1.5 – 2.0 mg/L setpoint typically reduces blower energy consumption by over 30%, offering a return on investment (ROI) in under 18 months without requiring complex BNR algorithms.
Why is my MLSS high but my BOD removal is poor?
This situation often implies a low active biomass fraction. You must perform Mixed Liquor Volatile Suspended Solids (MLVSS) Tracking. If your MLSS is 3,000 mg/L but the MLVSS is only 1,200 mg/L, your basin is full of inert ash, grit, or inorganic precipitants, not living bacteria. You may need to evaluate primary clarifier grit removal efficiency or investigate industrial dischargers dumping inorganic compounds into the collection system.
How often should online optical TSS sensors be calibrated?
While Online Optical TSS Sensors provide real-time data for Wasting Rate (WAS) Automation, their optical windows are prone to biofouling. Even with automated air-blast or mechanical wiper cleaning systems, the baseline correlation to laboratory gravimetric data drifts. Engineers generally recommend a single-point calibration check against a lab grab sample at least once every two to four weeks, depending on the fouling characteristics of the specific plant’s mixed liquor.
8) CONCLUSION
- Lab vs. Online: Biochemical Oxygen Demand (BOD5) Testing is strictly for regulatory compliance and historical sizing. Real-time protection requires Chemical Oxygen Demand (COD) Monitoring or UV254 sensors.
- The Heart of Control: Solid Retention Time (SRT) Optimization is the master lever of the activated sludge process. It governs everything from carbon removal to full nitrification.
- Settleability Matters: Always monitor the Sludge Volume Index (SVI) Calculation. A plant with great BOD removal but terrible SVI will still fail effluent limits due to clarifier washout.
- Automation ROI: Upgrading from manual valves to Return Activated Sludge (RAS) Pacing and Aeration Blower VFD Control provides the fastest operational payback through energy savings and process stability.
- Technology Match: Do not specify maintenance-intensive Respirometry BOD Analyzers for small plants without dedicated I&C technicians. Match the instrument complexity to operator capacity.
Mastering the concepts within the Wastewater Treatment Process Parameters: TSS BOD MLSS Guide is fundamental for any municipal or industrial water engineer. Biological wastewater treatment is not a black box; it is a highly predictable mass-balance equation governed by strict kinetics. By tracking the exact organic load (BOD/COD), maintaining the correct active biomass inventory (MLSS/MLVSS), and continuously monitoring the process environment (DO, TN, TP), plants can achieve incredibly stringent effluent limits.
The decision methodology across these subcategories relies on balancing capital costs, operating labor, and regulatory risk. Where compliance limits are loose and flows are steady, manual sampling and simple gravimetric tracking are sufficient. However, as plants push toward advanced Biological Nutrient Removal and energy optimization, integrating robust online sensors with automated WAS and blower controls becomes mandatory. Engaging process instrumentation specialists early in the design phase ensures that the biological targets established on the engineer’s whiteboard translate successfully to stable, automated reality in the field.