
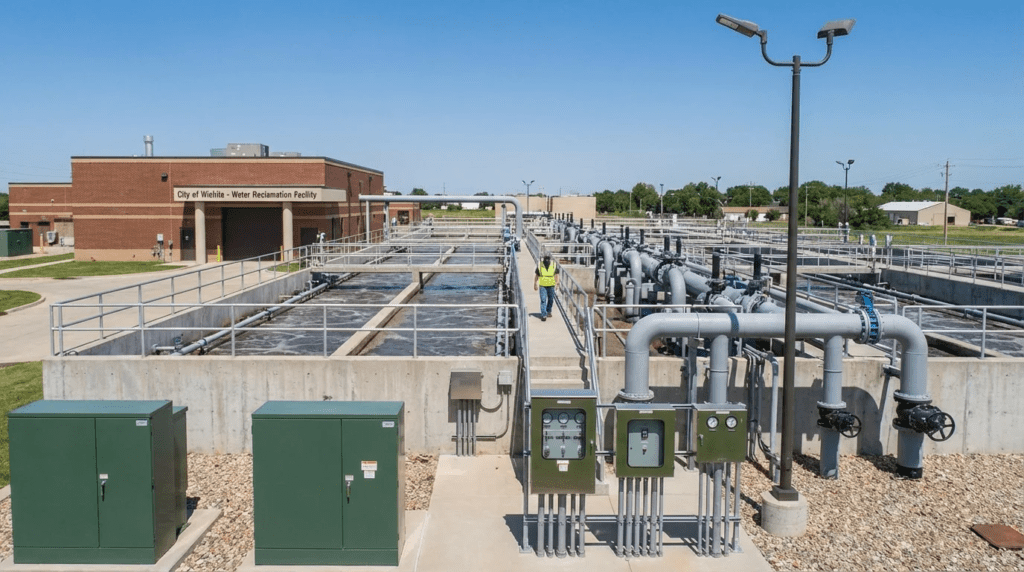
Introduction: The State of Kansas Water Infrastructure
Kansas presents a unique dichotomy in wastewater infrastructure, characterized by sophisticated, high-capacity biological nutrient removal (BNR) facilities in the rapid-growth corridors of Johnson County and Wichita, contrasted with hundreds of lagoon systems serving rural communities. For municipal consulting engineers and utility managers, the Kansas market is currently defined by a massive shift toward nutrient reduction compliance and capacity expansion to support industrial growth, particularly in the “Battery Belt” near De Soto.
Overseen by the Kansas Department of Health and Environment (KDHE), the state manages over 800 permitted wastewater facilities. The primary regulatory driver in the current cycle is the Kansas Nutrient Reduction Strategy, pushing mechanical plants toward stringent Nitrogen and Phosphorus limits to protect sensitive receiving waters like the Kansas and Arkansas Rivers. Currently, the state boasts a total treatment capacity exceeding 450 MGD (Million Gallons per Day), serving a population of approximately 2.9 million.
With the influx of Infrastructure Investment and Jobs Act (IIJA) funding and aggressive State Revolving Fund (SRF) management, Kansas is witnessing a capital improvement boom, particularly in advanced treatment technologies including Membrane Bioreactors (MBR) and water reuse initiatives for aquifer sustainability.
Kansas is profiled here as part of the site’s wider directory of US wastewater treatment plants, and the comparison is worth making because Kansas sits at an unusual regulatory midpoint. Its nutrient obligations are real and are driving hundreds of millions in retrofit spending, but they arrive through a state strategy and individual permit conditions rather than through an enforceable interstate allocation of the kind that governs Chesapeake Bay or Great Lakes dischargers.
Recent Developments & Projects
The Kansas wastewater sector has seen over $800 million in capital deployment over the last 36 months. The dominant trend is the retrofit of aging trickling filter and conventional activated sludge plants into advanced BNR facilities.
Key developments include:
- The Johnson County Wastewater (JCW) Expansion: JCW has executed one of the largest infrastructure programs in the Midwest, recently completing the Tomahawk Creek facility—one of the largest MBR installations in North America—and currently upgrading the Nelson Complex.
- Wichita’s Biological Nutrient Removal Program: Driven by regulatory mandates, the City of Wichita is investing heavily to modify its plants for enhanced nutrient removal to protect the Arkansas River.
- Panasonic Energy Impact: The massive EV battery plant construction in De Soto has triggered immediate, large-scale water and wastewater infrastructure expansion needs to support the industrial load and associated housing growth.
- Water Reuse Initiatives: Western Kansas communities, facing Ogallala Aquifer depletion, are pioneering direct non-potable reuse for agricultural and industrial applications, blending wastewater engineering with water resource management.
Top 20 Largest Wastewater Treatment Plants in Kansas
The following list ranks the largest wastewater treatment facilities in Kansas by design capacity. This data is compiled from KDHE permits, municipal CIPs, and direct utility reporting.
| Rank | Plant Name | City/Location | Design Capacity (MGD) | Population Served | Operating Authority |
|---|---|---|---|---|---|
| 1 | Lower Arkansas WWTF (Plant 2) | Wichita | 54.0 MGD | ~390,000 | City of Wichita |
| 2 | Nelson Complex | Mission | 26.5 MGD | ~180,000 | Johnson County Wastewater |
| 3 | Tomahawk Creek WWTF | Leawood | 19.0 MGD | ~150,000 | Johnson County Wastewater |
| 4 | Oakland WWTF | Topeka | 16.0 MGD | ~90,000 | City of Topeka |
| 5 | Kansas River WWTF | Lawrence | 12.5 MGD | ~75,000 | City of Lawrence |
| 6 | Cedar Creek WWTF | Olathe | 11.5 MGD | ~70,000 | City of Olathe |
| 7 | Blue River Main (KS Flow) | Overland Park | 11.0 MGD | ~60,000 | Johnson County Wastewater |
| 8 | Manhattan WWTF | Manhattan | 11.0 MGD | ~55,000 | City of Manhattan |
| 9 | North Topeka WWTF | Topeka | 10.0 MGD | ~35,000 | City of Topeka |
| 10 | Salina WWTF | Salina | 7.5 MGD | ~46,000 | City of Salina |
| 11 | Hutchinson WWTF | Hutchinson | 6.7 MGD | ~40,000 | City of Hutchinson |
| 12 | Wakarusa River WWTF | Lawrence | 6.0 MGD | ~25,000 | City of Lawrence |
| 13 | Four Mile Creek (Plant 1) | Wichita | 6.0 MGD | ~30,000 | City of Wichita |
| 14 | Harold Street WWTF | Olathe | 5.5 MGD | ~35,000 | City of Olathe |
| 15 | Leavenworth WWTF | Leavenworth | 5.3 MGD | ~36,000 | City of Leavenworth |
| 16 | Garden City WWTF | Garden City | 5.0 MGD | ~26,000 | City of Garden City |
| 17 | Emporia WWTF | Emporia | 4.5 MGD | ~24,000 | City of Emporia |
| 18 | Dodge City South WWTF | Dodge City | 4.2 MGD | ~27,000 | City of Dodge City |
| 19 | Middle Basin WWTF | Leawood | 4.0 MGD | ~20,000 | Johnson County Wastewater |
| 20 | Junction City West | Junction City | 3.5 MGD | ~22,000 | City of Junction City |
Detailed Profiles of the Top 5 Largest Plants
1. Lower Arkansas Wastewater Treatment Facility (Plant 2)
- Location: Wichita, Sedgwick County, KS
- Design Capacity: 54.0 MGD (Peak Wet Weather >100 MGD)
- Population Served: ~390,000 residents
- Operating Authority: City of Wichita Public Works
- Receiving Water: Arkansas River
Treatment Process: The plant utilizes preliminary screening and grit removal, primary clarification, and a specialized biological nutrient removal (BNR) activated sludge process. Secondary clarification is followed by UV disinfection before discharge.
Infrastructure Highlights:
– Biosolids: Anaerobic digestion with beneficial land application.
– Energy: Co-generation facilities utilize biogas to offset electrical demand.
Recent Upgrades: The facility is currently undergoing the massive “BNR Improvements Project” (detailed in Section 4) to meet strict NPDES permits regarding nitrogen and phosphorus limits.
2. Nelson Complex (Mission Main)
- Location: Mission, Johnson County, KS
- Design Capacity: 26.5 MGD (Wet Weather Peak 86 MGD)
- Population Served: ~180,000 residents
- Operating Authority: Johnson County Wastewater (JCW)
- Receiving Water: Turkey Creek
Treatment Process: Conventional activated sludge transitioning to BNR. The complex handles flows from the Turkey Creek and Mill Creek basins. It utilizes trickling filters alongside activated sludge, though current upgrades are modernizing this approach.
Infrastructure Highlights:
– Odor Control: Extensive biotowers and chemical scrubbers due to proximity to residential zones.
– Solids: Centralized solids processing for multiple JCW facilities.
Compliance: Operating under a stringent Consent Order to eliminate wet weather overflows, driving significant investment in peak flow management.
3. Tomahawk Creek Wastewater Treatment Facility
- Location: Leawood, Johnson County, KS
- Design Capacity: 19.0 MGD (Peak 172 MGD)
- Population Served: ~150,000 residents
- Operating Authority: Johnson County Wastewater (JCW)
- Receiving Water: Blue River
Treatment Process: One of the world’s largest Membrane Bioreactor (MBR) facilities. Features coarse and fine screening, biological nutrient removal basins, GE/Suez membrane cassettes, and UV disinfection.
Infrastructure Highlights:
– Technology: MBR technology allows for a smaller footprint and produces reuse-quality effluent.
– Peak Flow: Highly sophisticated wet weather storage and treatment train capable of handling massive surges.
Notable Features: The recent $335 million expansion (completed 2022) replaced a joint facility with Kansas City, MO, giving JCW full autonomy. It is a flagship project for Black & Veatch and McCarthy Building Companies.
4. Oakland Wastewater Treatment Plant
- Location: Topeka, Shawnee County, KS
- Design Capacity: 16.0 MGD
- Population Served: ~90,000 residents
- Operating Authority: City of Topeka Utilities
- Receiving Water: Kansas River
Treatment Process: Utilizes an Integrated Fixed-Film Activated Sludge (IFAS) system to enhance nitrogen removal within existing tank volumes. Primary clarification and UV disinfection complete the train.
Compliance: The plant has been optimized to reduce nutrient loading to the Kansas River, a critical concern for downstream users (like Lawrence and WaterOne).
5. Kansas River Wastewater Treatment Plant
- Location: Lawrence, Douglas County, KS
- Design Capacity: 12.5 MGD (Peak 40 MGD)
- Population Served: ~75,000 residents
- Operating Authority: City of Lawrence Municipal Services
- Receiving Water: Kansas River
Treatment Process: Activated sludge process with recent modifications for biological nutrient removal. The facility handles the majority of the University of Kansas load.
Recent Upgrades: The 2018-2020 Nutrient Removal Improvements project added deep-bed denitrification filters and converted existing basins to A2/O processes.
Condensed Listings (Rank 6-20)
Large Regional Plants (Rank 6-10)
- Cedar Creek WWTF (Olathe): 11.5 MGD. Completed a major Phase 2 expansion in 2019 using vertical loop reactors.
- Blue River Main (JCW): 11.0 MGD. JCW flow component treated at the KCMO Blue River plant; critical inter-local agreement facility.
- Manhattan WWTF: 11.0 MGD. Recently upgraded mechanical solids dewatering to replace drying beds; serves Kansas State University.
- North Topeka WWTF: 10.0 MGD. Secondary plant serving northern Shawnee County; utilizes trickling filter/solids contact process.
- Salina WWTF: 7.5 MGD. Currently in planning for major upgrades to address sulfate limits and aging infrastructure.
Major Municipal Plants (Rank 11-15)
- Hutchinson WWTF: 6.7 MGD. Operates an innovative groundwater remediation interaction; serves major industrial salt/ethanol sector.
- Wakarusa River WWTF (Lawrence): 6.0 MGD. Newest major plant in the region (commissioned 2018) to handle western expansion.
- Four Mile Creek (Wichita): 6.0 MGD. Serves rapidly growing eastern Wichita suburbs; scheduled for BNR retrofits.
- Harold Street WWTF (Olathe): 5.5 MGD. Older facility currently undergoing optimization; focused on odor control and peak flows.
- Leavenworth WWTF: 5.3 MGD. Located near Ft. Leavenworth; critical upgrades planned for influent pump station.
Facility Profiles & Plant Records
Kansas concentrates its mechanical treatment capacity in four systems: Wichita, Johnson County Wastewater, Topeka, and Lawrence. The records below cover the individual facilities documented in detail on this site. Coverage currently favors the Wichita and Topeka municipal systems; the Johnson County and Kansas City metro facilities are described in the rankings above but do not yet have dedicated plant records.
City of Wichita Water Pollution Control
The City Of Wichita Wichita Water Pollution Control Plant record covers the largest municipal treatment operation in Kansas, anchored by the 54 MGD Lower Arkansas facility with peak wet weather capability above 100 MGD, alongside the smaller Four Mile Creek plant serving the eastern suburbs. The process train runs preliminary screening and grit removal, primary clarification, biological nutrient removal activated sludge, secondary clarification, and UV disinfection to the Arkansas River. Solids are anaerobically digested with biogas cogeneration offsetting plant electrical demand and the resulting biosolids land-applied, which is a workable arrangement in Sedgwick County but one increasingly exposed to tightening vector attraction reduction requirements. The system is midway through a roughly $357 million BNR improvements program funded almost entirely through a WIFIA loan, which will retrofit both plants for nitrogen and phosphorus removal by 2027. That single program represents more than half of the state’s currently active capital investment, making Wichita the dominant procurement opportunity in Kansas for aeration, blower, chemical feed, and solids handling equipment. Engineers benchmarking BNR retrofit costs on a conventional activated sludge base should treat Wichita as the state’s reference project.
City of Topeka North Topeka Water Reclamation
The City Of Topeka North Topeka Wastewater Treatment Facility is the smaller of Topeka’s two plants at roughly 10 MGD, serving about 35,000 people in northern Shawnee County. It operates a trickling filter and solids contact process, a configuration that is energy-efficient and forgiving to operate but performs poorly against the nitrogen limits the Kansas Nutrient Reduction Strategy is progressively introducing. That makes North Topeka a useful case study in the retrofit problem facing dozens of mid-size Kansas plants: fixed-film processes cannot simply be tuned into nitrification and denitrification the way suspended growth systems can. The practical options are IFAS conversion, which is what Topeka applied at its larger Oakland facility, a supplementary suspended growth stage, or wholesale replacement. Discharge to the Kansas River places the plant upstream of Lawrence and the WaterOne intakes, so nutrient loading here has direct downstream water supply implications. Utilities operating trickling filter plants elsewhere in the state should watch how Topeka sequences the two facilities.
Field Notes for Engineers & Operators
Working the Kansas market means navigating a narrow set of funding routes and a very wide range of plant sophistication. The notes below reflect the practical constraints that shape design and procurement across that range.
Nutrient Retrofits on a Loan-Funded Balance Sheet
Kansas nutrient compliance is funded overwhelmingly through debt rather than grants: SRF and WIFIA loans dominate because their rates beat traditional municipal bonds, but they still land on the utility’s rate base. The consequence for design is that lifecycle cost carries more weight in Kansas evaluations than first cost, and options that reduce ongoing chemical or energy demand tend to win over cheaper capital installations. Biological phosphorus removal is preferred to chemical precipitation wherever influent characteristics permit it, and IFAS retrofits inside existing tankage are preferred to new concrete. Engineers presenting alternatives should carry a twenty-year operating cost comparison rather than a construction estimate alone. Utilities that skip that analysis frequently discover the chemical bill for a metal salt program exceeds the debt service they avoided.
The Lagoon Retrofit Problem
Of the state’s roughly 800 permitted facilities, only about 60 to 80 are major mechanical plants. The rest are largely facultative lagoons serving small communities, and they face ammonia and nutrient limits their basic process cannot meet at any operating adjustment. Cost-effective retrofit paths do exist, including submerged attached growth reactors for ammonia polishing, partial mixing and aeration upgrades, and covers that improve winter performance, but each adds an operating burden to a system chosen precisely because it required almost none. The realistic outcomes for these communities are a targeted lagoon upgrade, a small package mechanical plant, or regionalization with a neighboring utility. Alternatives analyses comparing all three, with honest operator-time estimates attached, are a steady line of work in Kansas and will remain so past the current federal funding cycle.
Working the Bi-State Kansas City Market
The Kansas City metropolitan area spans the state line, and the utilities on each side operate under separate regulatory agencies, separate revolving fund programs, and separate procurement rules. Johnson County Wastewater’s Tomahawk Creek project is instructive here: the $335 million facility replaced a joint treatment arrangement with Kansas City, Missouri, giving the county full operational autonomy over flow it had previously sent across the line. That kind of unwinding is increasingly common as growth on the Kansas side outpaces the terms of legacy inter-local agreements. Note that one flow component, Blue River Main, is still treated at the Missouri facility under agreement. Consultants and suppliers covering the metro need both states’ regulatory calendars and should not assume a relationship on one side transfers to the other.
Pro Tip
When scoping a nutrient retrofit at a Kansas trickling filter plant, price the IFAS conversion and the suspended growth addition side by side before assuming the fixed-film asset can be salvaged. Trickling filters are excellent carbon removal devices and poor nitrifiers, and the tankage that makes an IFAS retrofit attractive at one plant frequently does not exist at another. The site walk that answers this question costs a fraction of a preliminary design built on the wrong assumption.
Plants with Approved Budgets & Expansion Projects
Kansas utilizes a robust mix of State Revolving Funds (SRF), WIFIA loans, and local revenue bonds to fund infrastructure. Below is a breakdown of the most significant active capital projects.
A. Major Projects Under Construction (2024-2026)
Wichita Biological Nutrient Removal (BNR) Improvements – $350+ Million
- Location: Wichita, KS (Plants 1 & 2)
- Project Scope: Comprehensive retrofit of both major treatment plants to achieve biological nitrogen and phosphorus removal. Includes new aeration basins, blowers, and solids handling improvements.
- Total Budget: Est. $357 Million
- Funding Breakdown:
- 95% WIFIA Loan (EPA)
- 5% Local Revenue Bonds
- Timeline: Construction started late 2023; Completion expected 2027.
- Key Contractors:
- Design Engineer: Burns & McDonnell
- Construction Manager at Risk (CMAR): Garney Construction
- Drivers: Compliance with new KDHE nutrient reduction requirements and aging asset replacement.
Nelson Complex Improvements (Phase 1 & 2) – $280 Million
- Location: Mission, KS
- Project Scope: Replacement of aging trickling filters with activated sludge, hydraulic peak flow management improvements to 86 MGD, and new headworks.
- Total Budget: $280 Million (Phased)
- Funding Breakdown:
- Kansas SRF Loans
- JCW Revenue Bonds
- Timeline: Phase 1 active; Phase 2 Design ongoing through 2025.
- Key Contractors:
- Design Engineer: HDR / Black & Veatch
- General Contractor: McCarthy Building Companies
- Drivers: Wet weather overflow reduction (Consent Order) and asset renewal.
De Soto Water/Wastewater Expansion (Panasonic Project) – $50 Million
- Location: De Soto, KS
- Project Scope: Expansion of treatment capacity and conveyance to support the new Panasonic EV battery manufacturing facility.
- Funding: State grants, KDOT economic development funds, local match.
- Timeline: Fast-tracked for 2024-2025 completion.
- Drivers: Massive industrial economic development.
B. Projects in Design/Planning Phase (2025-2027)
- Salina WWTF Improvements:
Budget: ~$25 Million
Scope: Headworks replacement and grit removal upgrades. Currently in SRF planning stage. - Manhattan Northside Expansion:
Budget: ~$15 Million
Scope: Capacity expansion to accommodate growth in the NBAF (National Bio and Agro-Defense Facility) corridor. - Olathe Cedar Creek Phase 3:
Budget: TBD
Scope: Future planning for ultimate buildout capacity as western Olathe fills in.
C. Recently Completed Major Projects (2022-2024)
- Tomahawk Creek WWTF (Johnson County): Completed 2022. $335 Million. Converted a conventional plant to a 19 MGD MBR facility. Award-winning project for collaborative delivery.
- Lawrence Nutrient Removal Project: Completed 2022. $65 Million. Successfully reduced effluent Nitrogen and Phosphorus to meet KDHE goals.
Summary Statistics
- Total Active Capital Investment: ~$680 Million currently active.
- Primary Project Drivers: Nutrient Compliance (60%), Wet Weather/Capacity (30%), Industrial Support (10%).
- Funding Sources: WIFIA and SRF loans dominate the landscape due to favorable interest rates compared to traditional municipal bonds.
- Technology Trend: A definitive move away from trickling filters toward Activated Sludge, BNR, and MBR technologies.
Regulatory & Compliance Landscape
The regulatory environment in Kansas is managed by the Kansas Department of Health and Environment (KDHE) Bureau of Water.
Key Regulations Affecting Engineering Decisions:
- Kansas Nutrient Reduction Strategy: This is the single biggest driver of capital costs. Major mechanical plants are now receiving NPDES permits with scheduled compliance dates for total nitrogen (TN) and total phosphorus (TP) limits. This forces upgrades to BNR processes.
- Harmful Algal Blooms (HABs): High-profile algal blooms in reservoirs like Milford Lake have accelerated political will to enforce phosphorus limits on upstream dischargers.
- PFAS Monitoring: While strict limits are still evolving, KDHE is conducting statewide inventory and sampling. Engineers should anticipate future PFAS destruction or removal requirements in upcoming design cycles.
- Biosolids Management: Kansas generally supports beneficial reuse (land application) of Class B biosolids, but increasing regulations on vector attraction reduction are pushing utilities toward better digestion or thermal drying technologies.
How Nutrient Limits Actually Arrive in Kansas
Unlike the Chesapeake Bay states, Kansas dischargers are not working against an enforceable interstate load allocation. The Kansas Nutrient Reduction Strategy sets direction, and limits reach individual facilities through permit renewals, compliance schedules attached to those renewals, and antidegradation review triggered by expansion projects. That structure has two practical consequences. First, timing varies by facility, so a utility’s compliance deadline depends heavily on where its permit sits in the five-year renewal cycle rather than on a statewide date. Second, the numbers themselves are often established through negotiation informed by receiving water conditions, which means early technical engagement with KDHE genuinely affects the outcome. Utilities that wait for a limit to appear in a draft permit have already lost most of their leverage.
Reservoir Water Quality and Upstream Dischargers
Kansas depends on constructed reservoirs for a large share of its public water supply, and those reservoirs have proven vulnerable to harmful algal blooms driven by nutrient loading. Milford Lake has been the most visible case, but the pattern recurs across the reservoir system, and the political response has consistently been to look upstream at point source dischargers even where agricultural runoff carries the larger load. For a small city discharging to a tributary of a bloom-affected reservoir, that means phosphorus limits can arrive well ahead of what the facility’s size alone would suggest. Sedimentation is compounding the problem by reducing reservoir storage volume, which concentrates the nutrient load in less water. Engineers working upstream of a listed reservoir should assume phosphorus limits are coming regardless of plant capacity.
Infrastructure Challenges & Opportunities
The Rural/Urban Divide: Kansas faces a distinct split. Urban centers (KC Metro, Wichita, Topeka) have the tax base to fund massive advanced treatment plants. Conversely, rural Kansas relies on hundreds of facultative lagoons. The challenge for engineers is providing cost-effective upgrades (like SAGR systems or Lemna covers) to small lagoons to meet new nutrient limits without bankrupting small towns.
Workforce Shortage: There is a critical shortage of Class III and IV certified operators. This is driving a trend toward SCADA automation and remote monitoring technologies in new plant designs to reduce the manual labor burden.
Water Reuse Opportunities: In Western Kansas, where the Ogallala Aquifer is declining, wastewater is increasingly viewed as a resource. Projects involving effluent reuse for crop irrigation and industrial cooling are high-priority opportunities for engineering firms.
Technology Trends in Kansas
Based on recent bid tabs and project awards, the following technologies are trending in the Kansas market:
- Membrane Bioreactors (MBR): Validated by the success of the Tomahawk Creek plant, MBR is now the standard for footprint-constrained sites requiring high-quality effluent.
- UV Disinfection: Nearly universal replacement of chlorine gas systems to improve safety and reduce chemical byproducts.
- Integrated Fixed-Film Activated Sludge (IFAS): Being used to retrofit existing aeration basins to increase biomass and treatment capacity without building new concrete tanks.
- Thermal Hydrolysis: Being explored by larger utilities to improve anaerobic digestion efficiency and reduce biosolids volume.
Resources for Engineers & Operators
- Kansas Water Environment Association (KWEA) – The state’s primary professional organization, hosting an annual conference vital for networking.
- KDHE Bureau of Water – Access to NPDES permits, SRF funding applications, and regulatory guidance.
- Kansas Municipal Utilities (KMU) – Provides training and advocacy for city-owned utilities.
- Kansas Operator Certification – Information on testing and renewal for Class I-IV wastewater operators.
Frequently Asked Questions
- What is the largest wastewater treatment plant in Kansas?
- The Lower Arkansas Wastewater Treatment Facility (Plant 2) in Wichita is the largest, with a design capacity of 54 MGD and peak flow capabilities exceeding 100 MGD.
- How many permitted wastewater facilities are in Kansas?
- There are over 800 permitted facilities. The majority are small non-discharging or discharging lagoons, with approximately 60-80 major mechanical treatment plants.
- What is the “Tomahawk Creek” project?
- It was a $335 million project by Johnson County Wastewater, completed in 2022, that converted a conventional plant into one of the largest Membrane Bioreactor (MBR) facilities in North America.
- Are Kansas plants required to remove Nitrogen and Phosphorus?
- Yes. The Kansas Nutrient Reduction Strategy is progressively adding N and P limits to NPDES permits, forcing most major mechanical plants to upgrade to Biological Nutrient Removal (BNR) technologies.
- What funding is available for WWTP upgrades in Kansas?
- The primary source is the Kansas Water Pollution Control Revolving Fund (SRF), managed by KDHE. Recently, large utilities like Wichita have also successfully utilized federal WIFIA loans.
- Who operates the wastewater plants in Johnson County?
- Johnson County Wastewater (JCW) is a separate utility department under the County Board of Commissioners, operating independently of the individual cities (like Overland Park or Leawood) within the county.
- How is the Panasonic battery plant affecting Kansas water infrastructure?
- The massive development in De Soto has triggered expedited projects to expand water and wastewater conveyance and treatment capacity to handle the new industrial load and expected population surge.
- Why are trickling filter plants a problem under the new nutrient limits?
- Trickling filters and trickling filter/solids contact processes are efficient at carbon removal but poor at nitrification, and they cannot simply be tuned to nitrify and denitrify the way suspended growth systems can. Several Kansas plants, including North Topeka, run this configuration. The realistic retrofit paths are IFAS conversion where existing tankage allows it, adding a suspended growth stage, or replacing the process outright. Topeka’s Oakland facility took the IFAS route, which is why it is a common reference point in state planning studies.
- Does Kansas wastewater cross state lines?
- Yes, in the Kansas City metro. Johnson County Wastewater’s Blue River Main flow component is treated at the Kansas City, Missouri Blue River plant under an inter-local agreement. The Tomahawk Creek project ran the other direction, replacing a joint treatment arrangement with a county-owned MBR facility and giving JCW autonomy over that flow. Utilities on either side of the line operate under separate state agencies, so metro-wide work requires tracking both regulatory calendars.
- What are the options for small Kansas lagoon communities facing new limits?
- Three, generally. A targeted lagoon retrofit adding ammonia polishing, aeration, or covers keeps the existing asset but adds an operating burden. A small package mechanical plant delivers reliable compliance at higher capital and staffing cost. Regionalization sends flow to a neighboring utility, trading capital for a conveyance line and a service agreement. Federal IIJA and SRF money has made all three viable for communities that could not previously fund any of them.
Conclusion
Key Takeaways
- Nutrients drive the market — roughly 60 percent of active capital spending traces to the Kansas Nutrient Reduction Strategy rather than to wet weather or growth.
- Limits arrive facility by facility — with no enforceable interstate allocation, compliance dates follow the permit renewal cycle and the numbers are shaped by early technical engagement with KDHE.
- Wichita is the dominant project — the roughly $357 million BNR retrofit, 95 percent WIFIA-funded, is more than half the state’s active investment.
- Trickling filters are the retrofit problem — fixed-film plants cannot be tuned into nitrification, so IFAS conversion, added suspended growth, or replacement are the only paths.
- Debt funding rewards lifecycle thinking — SRF and WIFIA loans land on the rate base, so operating cost comparisons carry more weight in Kansas evaluations than first cost.
- The long tail is lagoons — only 60 to 80 of roughly 800 permitted facilities are major mechanical plants; the rest face upgrade, package plant, or regionalization decisions.
Kansas is a market defined by contrast. A handful of utilities are executing projects that would be notable in any state, including one of North America’s largest membrane bioreactor installations and a nutrient retrofit financed almost entirely through a federal WIFIA loan. Several hundred small communities are simultaneously working out how to meet an ammonia limit with a two-cell lagoon and a part-time operator. Both ends of that spectrum are active, and the roughly $680 million in current work is distributed across them unevenly.
For engineers, operators, and suppliers, the useful first question is which of three markets a project belongs to: metropolitan nutrient and capacity work funded through WIFIA and large SRF loans, mid-size municipal retrofits driven by permit renewal timing, or small-community upgrades riding federal grant cycles. Each has a different buyer, a different decision timeline, and a different technology fit. The facility records linked in this guide are the starting point for placing a project correctly.