
Massachusetts Wastewater Treatment Plants
Introduction
Wastewater treatment plants play a crucial role in maintaining public health and environmental sustainability. In Massachusetts, a state known for its rich history and diverse ecosystems, these facilities are essential in managing the byproducts of urban and industrial activities. This article delves into the intricate world of wastewater treatment in Massachusetts, exploring the technologies, processes, challenges, and future directions.
Massachusetts occupies a distinctive place within the wider US treatment plants landscape. The Boston Harbor cleanup that produced the Deer Island facility is among the most consequential wastewater projects ever undertaken in the United States, and the regulatory pressure that drove it — a federal court order rather than a routine permit renewal — shaped how the state’s largest systems were rebuilt. Understanding the facilities here means understanding that history.
Overview of Wastewater Treatment in Massachusetts
Massachusetts, with its population exceeding 6.8 million, generates significant amounts of wastewater daily. The state’s wastewater treatment infrastructure comprises numerous plants, ranging from small municipal facilities to large regional treatment centers. These plants collectively treat billions of gallons of wastewater annually, safeguarding water quality in the state’s rivers, lakes, and coastal waters.
Regional Context
The pressures on Massachusetts facilities are broadly shared across the Northeast — dense legacy collection systems, combined sewers in older cities, coastal and estuarine discharge with nutrient sensitivity, and a large stock of infrastructure built or rebuilt during the same federal funding era. Readers comparing regional approaches will find similar patterns in the directories for Connecticut, which shares the Long Island Sound nitrogen framework, and for New York and New Jersey, where combined sewer overflow abatement has followed a comparable trajectory under federal consent agreements.
How Massachusetts Communities Are Served
Not every community in the state is served the same way, and the arrangement matters because it determines who holds the permit, who funds capital work, and what technical capacity is available locally.
Regional Authority
The Massachusetts Water Resources Authority is the state’s only wastewater entity of its scale, serving dozens of member communities across metropolitan Boston through a single treatment system. Member communities own and operate their local collection systems and pay assessments to the authority, which owns and operates the interceptors and treatment works. The advantage is obvious — capital projects of a magnitude no individual town could finance become possible — and the trade-off is equally clear, since member communities have limited direct control over an assessment that forms a significant part of their water and sewer rates.
Multi-Community Districts
Away from Boston, the dominant model is the regional district: a separate public entity formed by several municipalities to build and operate a shared facility. Greater Lawrence, South Essex, and Upper Blackstone all follow this pattern. Districts spread capital cost and operating expertise across communities that individually would struggle to sustain either, and they allow a facility to be sized appropriately for a watershed rather than for a municipal boundary. Their governance — typically a board with member community representation — can make major capital decisions slower than a single municipality would find them.
Municipal Systems
Many communities own and operate their own treatment works, ranging from substantial city facilities such as the Springfield system down to small plants serving a few thousand people. The challenges scale inversely with size: smaller municipal plants face the same regulatory requirements as large ones while having far less staff, less engineering capacity, and a much smaller rate base across which to spread compliance costs. Where a nutrient limit tightens, a small municipal plant feels it disproportionately.
Onsite and Decentralized Systems
A substantial share of Massachusetts households — particularly on Cape Cod, the Islands, and in rural western Massachusetts — are not connected to any sewer at all and rely on onsite septic systems regulated under the state’s Title 5 code. These systems are the reason nitrogen loading to coastal embayments has become such a prominent issue: conventional septic systems remove very little nitrogen, and dense onsite development over a shallow aquifer delivers that nitrogen to the receiving water regardless of what the region’s treatment plants achieve. Several Cape communities have consequently faced the choice between large-scale sewering, enhanced onsite treatment requirements, or watershed permitting arrangements — a decision with implications far beyond wastewater engineering.
Massachusetts Treatment Facility Directory
The facilities below are the major regional systems covered in detail. Between them they serve a substantial share of the state’s population, and they illustrate the range of arrangements found in Massachusetts — a large regional authority, several multi-community districts, and a municipal commission.
Metropolitan Boston
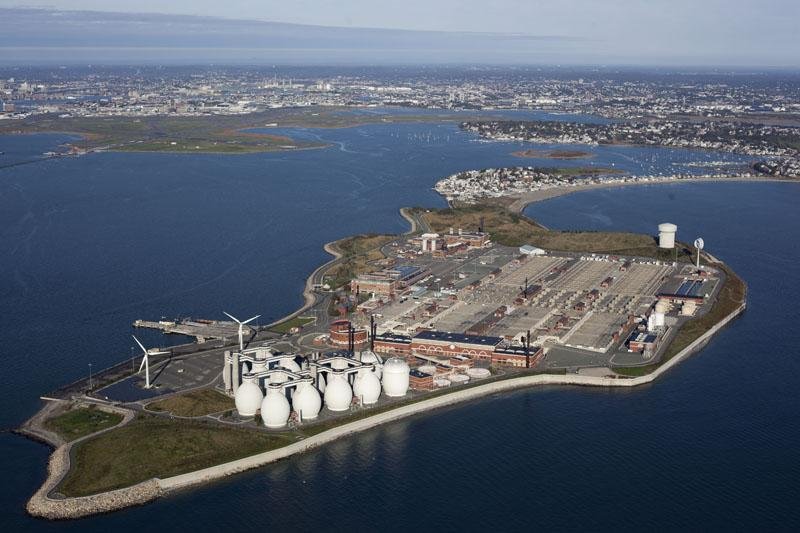
The Deer Island Sewage Treatment Plant is the state’s largest facility and the centrepiece of the Boston Harbor cleanup. Coverage addresses its treatment train, the egg-shaped digesters that have become a Boston landmark, and the outfall tunnel that carries treated effluent well offshore into Massachusetts Bay. A parallel profile of the MWRA Deer Island Treatment Plant addresses the same facility from the authority’s perspective, covering the Massachusetts Water Resources Authority as an organization, its service area across dozens of member communities, and the governance and financing arrangements that made a project of that scale possible.
Merrimack Valley and North Shore
North of Boston, regional districts handle wastewater for clusters of communities that individually could not support facilities of the necessary scale. The Greater Lawrence Sanitary District serves the Merrimack Valley, with a companion profile of the Greater Lawrence Sanitary District North plant covering the same district’s operations in further detail. On the North Shore, the South Essex Sewerage District serves several coastal communities and faces the combination of ageing collection infrastructure and coastal discharge that characterizes much of the region.
Central and Western Massachusetts
Away from the coast, the receiving waters are rivers, which changes the regulatory picture entirely. The Upper Blackstone Water Pollution Abatement District serves the Worcester area and discharges to the Blackstone River, a watershed that flows into Rhode Island and has therefore been subject to some of the most closely scrutinized nutrient requirements in New England. Further west, the City of Springfield Bondi’s Island facility serves the Springfield area and discharges to the Connecticut River, where interstate water quality considerations again shape permit conditions.
Key Wastewater Treatment Plants in Massachusetts
Deer Island Treatment Plant
Located in Boston Harbor, the Deer Island Treatment Plant is one of the largest and most technologically advanced wastewater treatment facilities in the United States. Operated by the Massachusetts Water Resources Authority (MWRA), it serves approximately 2.5 million residents across 43 communities. The plant has a treatment capacity of 1.3 billion gallons per day, employing state-of-the-art technologies to ensure high-quality effluent discharge into Massachusetts Bay.
Treatment Process
The treatment process at Deer Island involves several stages:
- Preliminary Treatment: Removes large debris and grit through screening and sedimentation.
- Primary Treatment: Utilizes gravity to separate solids from liquid waste.
- Secondary Treatment: Employs biological processes to break down organic matter using activated sludge.
- Disinfection: Chlorination and dechlorination processes reduce pathogenic microorganisms before discharge.
- Sludge Processing: Anaerobic digestion converts sludge into biosolids and biogas, which is used to generate energy.
Greater Lawrence Sanitary District
Located in North Andover, the Greater Lawrence Sanitary District (GLSD) serves the communities of Lawrence, Methuen, Andover, North Andover, and Salem, New Hampshire. The plant treats an average of 52 million gallons of wastewater per day.
Innovative Practices
GLSD is known for its innovative approaches to wastewater management, including:
- Energy Recovery: Utilizing anaerobic digestion to produce biogas, which powers the facility.
- Nutrient Removal: Implementing advanced nutrient removal processes to protect the Merrimack River.
South Essex Sewerage District
Serving Salem, Beverly, Danvers, Marblehead, and Peabody, the South Essex Sewerage District (SESD) treats approximately 30 million gallons of wastewater daily. The facility focuses on:
- Nitrogen Removal: Advanced processes to reduce nitrogen levels, protecting the Salem Sound ecosystem.
- Community Engagement: Educational programs to promote water conservation and pollution prevention.
The Regulatory Landscape in Massachusetts
Understanding why Massachusetts facilities operate as they do requires understanding the regulatory framework, which differs from most other states in one important respect.
Permitting Authority
Massachusetts is among the small number of states where the federal Environmental Protection Agency retains direct NPDES permitting authority rather than delegating it to the state. In practice this means discharge permits for Massachusetts facilities are issued by EPA Region 1, working alongside the Massachusetts Department of Environmental Protection, which administers state surface water quality standards and its own certification requirements. For plant operators the practical consequence is that permit negotiations and compliance discussions involve both a federal and a state agency, and that federal enforcement priorities are felt more directly here than in delegated states.
Water Quality Standards and Nutrient Limits
State surface water quality standards establish designated uses and criteria for the waters receiving each discharge, and it is the receiving water that ultimately determines how stringent a permit becomes. Coastal and estuarine discharges face nitrogen scrutiny because nitrogen is the limiting nutrient in marine systems; inland river discharges face phosphorus limits because phosphorus limits freshwater productivity. That distinction explains much of the variation between Massachusetts facilities — a plant discharging to a Cape Cod embayment, one discharging to the Blackstone River, and one discharging offshore into Massachusetts Bay operate under genuinely different constraints despite treating similar wastewater.
Combined Sewer Overflows
Older Massachusetts cities were built with combined sewers that carry sewage and stormwater in the same pipe, and during heavy rainfall these systems discharge untreated or partially treated flow to receiving waters. Abatement has been pursued through long-term control plans, frequently under federal consent decrees, involving storage tunnels, sewer separation, treatment of overflow, and increased conveyance capacity. This work is generational in scale and cost, and it is the single largest capital driver for the affected communities.
Operator Certification and Funding
Facility operators are certified by the state across graded classes matched to plant complexity, and a certified operator of appropriate grade must be in responsible charge of each facility. On the funding side, the Clean Water State Revolving Fund provides subsidized loans for treatment and collection system projects, administered through the state’s environmental agency and financing trust. As elsewhere, the revolving fund lowers the cost of capital substantially but is sized well below aggregate need, which leaves rate revenue as the primary funding mechanism.
Comparing Massachusetts Facilities
The table below compares the major facilities covered here on the characteristics that most affect how each operates. Details are as described in the facility profiles and vary with source and reporting date.
| Facility | Operator Type | Service Area | Receiving Water | Dominant Driver | Notable Feature |
|---|---|---|---|---|---|
| Deer Island | Regional authority (MWRA) | Metropolitan Boston, dozens of communities | Massachusetts Bay via offshore outfall | Court-ordered harbour cleanup; marine discharge | Egg-shaped digesters; long outfall tunnel |
| Greater Lawrence Sanitary District | Multi-community district | Merrimack Valley, including a New Hampshire community | Merrimack River | River nutrient protection; CSO abatement | Biogas energy recovery from digestion |
| South Essex Sewerage District | Multi-community district | North Shore coastal communities | Salem Sound | Coastal nitrogen; ageing collection system | Nitrogen removal for a sensitive sound |
| Upper Blackstone | Regional district | Worcester area | Blackstone River (interstate) | Downstream state water quality; phosphorus | Among the region’s most scrutinized nutrient permits |
| Springfield Bondi’s Island | Municipal commission | Springfield area, western Massachusetts | Connecticut River (interstate) | Interstate river quality; CSO abatement | Largest facility in western Massachusetts |
| Smaller municipal plants | Municipal | Individual towns statewide | Local rivers and embayments | Local water quality; funding capacity | Frequently constrained by operator availability |
Technologies and Innovations
Massachusetts wastewater treatment plants employ a variety of technologies to enhance efficiency and environmental performance.
Advanced Treatment Technologies
- Membrane Bioreactors (MBRs): Combining biological treatment with membrane filtration, MBRs produce high-quality effluent and are increasingly used in facilities facing space constraints.
- UV Disinfection: An environmentally friendly alternative to chlorination, UV disinfection effectively inactivates pathogens without producing harmful byproducts.
- Nutrient Recovery: Technologies to recover nitrogen and phosphorus from wastewater, converting them into valuable fertilizers.
Energy Efficiency and Renewable Energy
Many Massachusetts plants are integrating renewable energy sources to reduce operational costs and carbon footprints:
- Solar Power: Installing solar panels to harness renewable energy.
- Wind Turbines: Utilizing wind energy in coastal facilities.
- Biogas Utilization: Converting biogas from anaerobic digestion into electricity and heat.
Energy is worth emphasizing because it is both the largest controllable operating cost at most facilities and the area where Massachusetts plants have been comparatively active. Anaerobic digestion producing biogas for combined heat and power is the most substantial of these measures, since a plant with strong digestion can offset a meaningful fraction of its own electricity demand. Aeration control is the other major lever, typically accounting for half or more of a plant’s electricity, and dissolved oxygen control with variable-speed blowers routinely delivers double-digit percentage savings for a modest capital outlay.
Challenges Facing Wastewater Treatment in Massachusetts
Despite advancements, Massachusetts faces several challenges in wastewater management.
Aging Infrastructure
Many treatment plants and sewer systems in Massachusetts are decades old, leading to inefficiencies and increased maintenance costs. Upgrading infrastructure requires substantial investment and planning.
Combined Sewer Overflows (CSOs)
In older cities, combined sewer systems can overflow during heavy rainfall, discharging untreated sewage into water bodies. Addressing CSOs involves separating sewer systems and increasing storage capacity, which is costly and time-consuming.
Nutrient Pollution
Excess nutrients like nitrogen and phosphorus from wastewater can lead to eutrophication, harming aquatic ecosystems. Implementing advanced nutrient removal technologies is essential but requires significant investment.
Climate Change
Rising sea levels and increased storm intensity pose risks to coastal treatment plants, necessitating adaptive measures to protect infrastructure and ensure continuous operation.
Inflow and Infiltration
Even where sewers are separated, groundwater and rainwater enter through cracked pipe, defective joints, and improper connections. In a state with a large stock of century-old collection infrastructure, inflow and infiltration can double or triple flow during wet weather. The effect on a plant is peculiar and often misdiagnosed: contaminant mass arriving does not increase, but every hydraulic unit — clarifiers, disinfection contact tanks, filters — loses detention time precisely when the collection system is delivering its dirtiest flow. Collection system rehabilitation frequently buys more usable plant capacity per dollar than plant expansion does, though it is far less visible as a public investment.
Workforce and Operator Availability
A constraint rarely discussed publicly is staffing. Certified operators are retiring faster than they are being replaced across New England, and the problem falls hardest on smaller municipal systems that cannot match the wages, benefits, or career progression of larger authorities. A plant is only as good as the operator in responsible charge of it, and communities that cannot recruit at the required certification grade face genuine compliance risk regardless of how well the facility itself is built. Shared services arrangements, contract operations, and regional cooperation are increasingly used to address this.
Emerging Contaminants
A newer pressure affects Massachusetts alongside the rest of the region. Per- and polyfluoroalkyl substances pass through conventional treatment largely unchanged and concentrate in biosolids, which has begun to constrain land application and raise residuals disposal costs. Because these compounds are not destroyed by any conventional process, the practical response for utilities is source identification and control rather than treatment, and the cost impact arrives as a hauling and disposal problem rather than an effluent problem.
Practical Guidance: Finding Information on a Specific Plant
Readers researching a particular Massachusetts facility — whether for permitting work, academic research, community interest, or supplier prospecting — will find the following approach effective.
Start With the Permit
The discharge permit is the single most informative document about any facility. It states design flow, effluent limits for each regulated parameter, monitoring frequency, and any special conditions such as nutrient limits or CSO requirements. Permits and the fact sheets accompanying them are public records, and the fact sheet in particular explains the reasoning behind each limit, which is frequently more useful than the limit itself.
Then Check Compliance History
Federal enforcement and compliance databases publish reported discharge monitoring data alongside violation and enforcement history for permitted facilities. This reveals how a plant is actually performing rather than how it is permitted to perform, and patterns — seasonal ammonia excursions, wet weather solids exceedances — are frequently visible at a glance.
Finally, the Facility’s Own Reporting
Larger authorities and districts publish annual reports, capital improvement plans, and board materials that describe upcoming projects, current challenges, and financial position. For anyone tracking capital spending or approaching a facility commercially, these documents are considerably more current than any third-party directory.
Pro Tip: Read the permit fact sheet, not just the permit. The permit lists the numbers; the fact sheet explains where each one came from — which water quality standard drove it, what assumptions about receiving water flow were used, and whether a limit is expected to tighten at the next renewal. That reasoning tells you what a facility will be dealing with in five years, which the permit itself does not. Fact sheets are public and typically run to a few dozen readable pages.
Future Directions
The future of wastewater treatment in Massachusetts is focused on sustainability, resilience, and innovation.
Sustainable Practices
Efforts are underway to promote water reuse and resource recovery. Treated wastewater can be reused for irrigation, industrial processes, and even potable water supply, reducing the demand on freshwater resources.
Water reuse has developed differently in Massachusetts than in the arid west. Rather than being driven by supply scarcity, reuse here is typically driven by discharge constraints — where a receiving water cannot accept additional nutrient load, diverting treated effluent to irrigation, industrial use, or groundwater recharge can be more practical than treating to an ever-lower limit. Regulations govern the treatment level and permitted end uses, and the economics generally favour reuse only where a specific, nearby demand exists. Resource recovery follows similar logic: phosphorus recovery from digester sidestreams and biogas utilization both convert a disposal problem into a product, and both work best at facilities large enough to justify the equipment.
Climate Resilience
Plants are adopting measures to enhance resilience against climate change impacts, such as elevating critical infrastructure, improving stormwater management, and increasing energy efficiency.
Public Engagement and Education
Raising public awareness about the importance of wastewater treatment and water conservation is crucial. Educational programs and community involvement can foster a culture of environmental stewardship.
Policy and Regulation
Strengthening policies and regulations to address emerging contaminants, such as pharmaceuticals and microplastics, is essential. Collaboration between government agencies, industries, and communities can drive effective solutions.
Working With Massachusetts Facilities
For engineers, suppliers, and consultants approaching facilities in the state, a few characteristics of the Massachusetts market are worth understanding before the first conversation.
Procurement Runs on Public Bidding
Municipal and district facilities procure under public bidding statutes, which means specifications must generally permit equivalent products, awards are made on defined and published criteria, and the timeline from specification to purchase order is measured in months rather than weeks. Suppliers whose products are named in a specification without an equivalency path frequently find that specification challenged. The practical implication is that influence happens at the design stage, through the consulting engineer, long before a bid is advertised.
The Consulting Engineer Is Usually the Gatekeeper
Most Massachusetts facilities of any scale retain an engineering consultant for capital work, and that firm writes the specification the eventual bid is measured against. Understanding which firms serve which districts, and what each has specified previously, tells you more about a facility’s likely direction than its own published materials do. Capital improvement plans, which most districts publish, name upcoming projects and frequently the engineer engaged for them.
Timing Follows the Funding Cycle
Capital work is driven by budget adoption, state revolving fund application rounds, and — where a consent decree applies — a court-supervised schedule. Consent decree milestones in particular are non-negotiable and publicly documented, which makes them the most reliable predictor of when a specific project will move. A facility operating under a long-term control plan has a published schedule of what must be built and by when, which is unusual visibility by any industry’s standard.
Resources and References
The sources below are the ones most useful for research on Massachusetts facilities, and all are publicly accessible.
- EPA Region 1 — issues NPDES permits for Massachusetts facilities and publishes permits, draft permits, and fact sheets explaining how limits were derived.
- Massachusetts Department of Environmental Protection — administers state surface water quality standards, operator certification, Title 5 onsite system regulation, and state revolving fund programmes.
- EPA compliance and enforcement databases — publish reported discharge monitoring data, violation history, and enforcement actions for permitted facilities nationwide.
- Massachusetts Water Resources Authority — publishes detailed operational, water quality, and capital planning information for the Deer Island system and its member communities.
- Regional district and municipal commission reporting — annual reports, capital improvement plans, and board materials from GLSD, SESD, Upper Blackstone, and the Springfield commission.
- New England Water Environment Association — regional professional association, with technical conferences and operator training relevant across the New England states.
- Clean Watersheds Needs Survey — periodic national assessment of wastewater infrastructure needs, reported by state.
Frequently Asked Questions
Who issues discharge permits for Massachusetts treatment plants?
EPA Region 1 does, working alongside the state environmental agency. Massachusetts is among the small number of states where federal NPDES permitting authority has not been delegated to the state, so permit negotiation and compliance involve both a federal and a state agency. This is a meaningful difference from most states and it affects how enforcement priorities are felt at facility level.
Why do nutrient limits differ so much between Massachusetts plants?
Because the receiving water determines the limit. Nitrogen is the limiting nutrient in marine and estuarine systems, so coastal and embayment discharges face nitrogen scrutiny. Phosphorus limits freshwater productivity, so river discharges face phosphorus limits. A plant discharging offshore into Massachusetts Bay, one discharging to the Blackstone River, and one discharging to a Cape Cod embayment therefore operate under genuinely different constraints while treating similar wastewater.
What is a combined sewer overflow and why does it matter here?
Older cities were built with a single pipe carrying both sewage and stormwater. During heavy rain the combined flow exceeds what the treatment plant can accept, and the excess discharges to receiving waters largely untreated. Massachusetts has a substantial legacy of these systems, and abatement — through storage tunnels, sewer separation, and increased conveyance — represents the largest single capital commitment for the affected communities.
How can I find out how a specific plant is performing?
Start with its discharge permit and the accompanying fact sheet, which state the limits and explain their basis. Then check the federal compliance databases, which publish reported monitoring data and any violation or enforcement history — this shows actual performance rather than permitted performance. Finally, larger authorities publish annual reports and capital plans that describe current projects and challenges.
What is driving capital spending at Massachusetts facilities?
Three things, in varying combination by location: combined sewer overflow abatement in the older cities, nutrient removal upgrades where the receiving water requires them, and replacement of ageing collection and treatment assets built or rebuilt during the federal construction grants era. Climate resilience — elevating critical equipment and hardening coastal facilities — is an increasingly significant fourth driver.
Key Takeaways
- EPA Region 1 issues the permits — Massachusetts is one of the few states without delegated NPDES authority, which changes how permitting and enforcement work.
- The receiving water sets the limits — nitrogen for coastal and estuarine discharges, phosphorus for rivers, which explains most of the variation between facilities.
- Deer Island exists because of a court order — the Boston Harbor cleanup was driven by federal litigation rather than routine permit renewal, and that history shaped the region’s infrastructure.
- Regional districts carry much of the load — GLSD, SESD, and Upper Blackstone serve clusters of communities that individually could not support facilities at the necessary scale.
- CSO abatement is the dominant capital driver in the older cities, and it is generational in both timescale and cost.
- Read the fact sheet, not just the permit — it explains where each limit came from and signals what is likely to tighten next.
- PFAS is arriving as a residuals problem — conventional treatment does not remove it, it concentrates in biosolids, and the cost lands on disposal rather than effluent.
Conclusion
Wastewater treatment in Massachusetts is a dynamic field, continually evolving to meet environmental and societal needs. With a commitment to innovation, sustainability, and community engagement, the state is well-positioned to address current and future challenges. By investing in advanced technologies and fostering collaboration, Massachusetts can ensure the protection of its water resources for generations to come.
For anyone working with or researching these facilities, the most useful starting point is not a directory but the permit — it states what each plant must achieve, and the accompanying fact sheet explains why. From there, compliance data shows actual performance and the facility’s own reporting shows what is coming next. Massachusetts is unusually well documented in this respect, partly because the Boston Harbor litigation established a level of public reporting that has persisted, and partly because federal rather than delegated permitting keeps the record in one accessible place.