
Understanding PFAS Contamination: Sources, Risks, and Treatment Solutions
Understanding PFAS Contamination: Sources, Risks, and Treatment Solutions
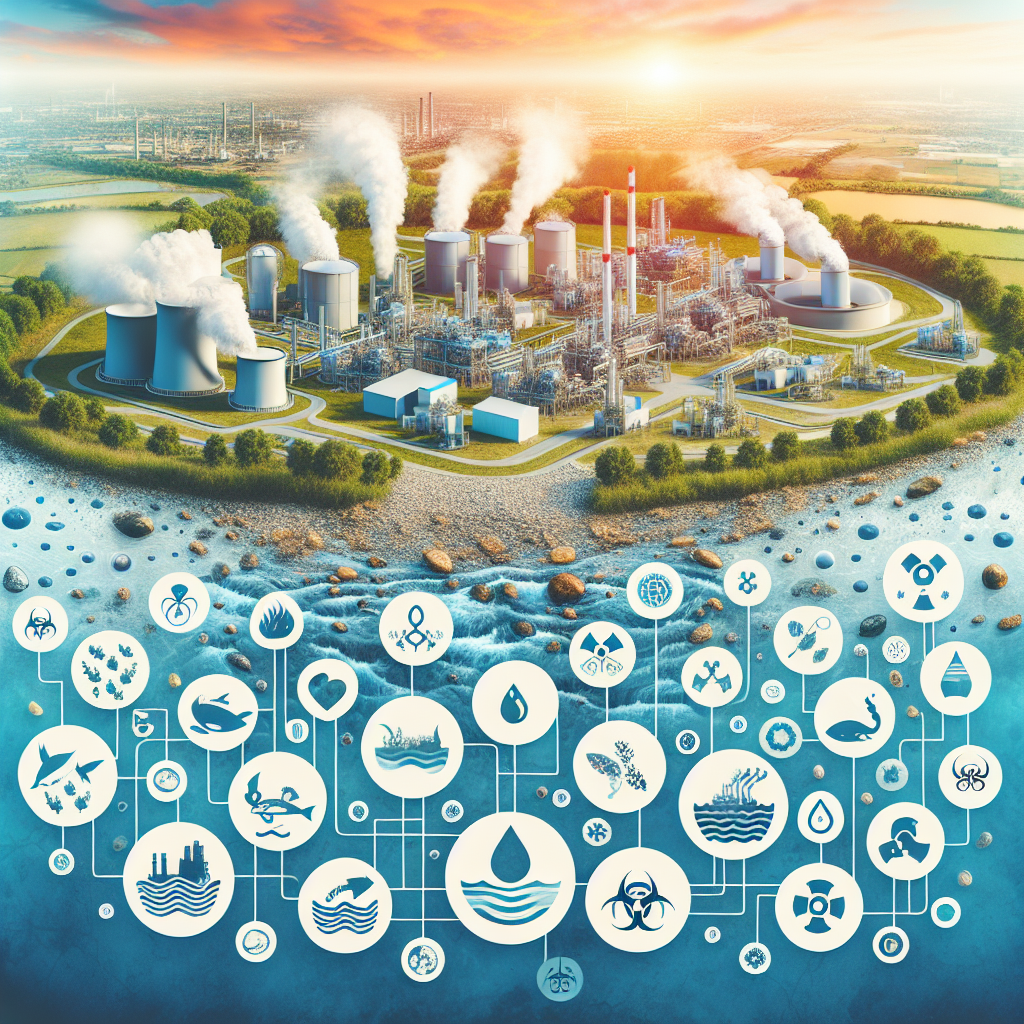
Where PFAS Contamination Comes From
PFAS contamination is rarely diffuse and mysterious. In most affected systems it traces to a definable source, and identifying which one matters — it determines how the plume will behave, whether concentrations will rise or fall, whether costs can be recovered from a responsible party, and what treatment will face.
This article covers the sources, how PFAS moves through the environment, who is exposed and how, and what the risks are. Treatment technologies are covered separately in our overview of PFAS removal technologies.
The Major Source Categories
- Firefighting foam: Aqueous film-forming foam used at military installations, civilian airports, refineries, and fire training areas. These sites produce the highest concentrations found in groundwater and are the most common cause of severe local contamination.
- Fluorochemical manufacturing: Facilities producing PFAS or fluoropolymers, which release to air and water. Air deposition can contaminate soil and groundwater over a substantial radius.
- Industrial users: Metal plating (chrome mist suppressants), textile and leather treatment, paper and packaging coating, and semiconductor manufacturing.
- Landfills: Consumer products containing PFAS generate leachate that carries them out, typically to a wastewater plant that cannot remove them.
- Wastewater treatment plants: Not sources in themselves, but pass-through points that concentrate PFAS into effluent and biosolids.
- Land-applied biosolids: Where biosolids containing PFAS are applied to agricultural land, PFAS accumulate in soil and can migrate to groundwater and into crops and livestock.
Why the Source Category Matters
Each source produces a characteristic mixture. Foam sites carry large fractions of precursors that convert to regulated compounds over time, meaning concentrations can rise years after use stopped. Manufacturing sites often show distinctive replacement chemistries. Landfill leachate carries a broad mixture reflecting consumer products. Recognizing the pattern supports both source attribution and prediction of how contamination will develop.
How PFAS Moves
Persistence
The carbon-fluorine bond is among the strongest in organic chemistry, and it resists the biological and chemical processes that degrade most organic contaminants. Perfluorinated compounds do not meaningfully break down in the environment on human timescales. Polyfluorinated precursors do degrade — but into perfluorinated compounds, which then persist.
Transport in Water
PFAS are generally soluble and mobile in groundwater, and short-chain compounds are more mobile than long-chain ones. A practical consequence is that plumes often separate: short-chain compounds travel furthest and arrive first, while long-chain compounds are retarded closer to the source. A well at the leading edge of a plume may show a very different profile from one near the source.
Soil and Partitioning
Long-chain PFAS bind more strongly to soil organic matter, so they are retained nearer the source while shorter chains leach. PFAS also accumulate at air-water interfaces, including in the unsaturated zone, which affects how they migrate downward.
Air
Some PFAS — particularly volatile precursors such as fluorotelomer alcohols — travel through air and deposit at distance, which is how contamination appears well beyond any direct discharge. Ultrashort-chain compounds such as trifluoroacetic acid also form from atmospheric breakdown of fluorinated refrigerants.
Bioaccumulation
Long-chain PFAS accumulate in organisms, and concentrations increase up food chains. This is why fish consumption advisories for PFAS have been issued for water bodies in many states, and why contamination of agricultural land raises concerns about produce, dairy, and meat.
Exposure Routes
Drinking water receives the most attention, but it is one of several routes, and its relative importance depends on circumstances:
- Drinking water: The dominant route for communities with contaminated supplies, and the one regulation addresses directly.
- Food: Both from packaging and from agricultural products grown on affected land or irrigated with affected water.
- Consumer products: Stain-resistant textiles, some cosmetics, and non-stick cookware.
- Dust and indoor air: From treated furnishings and building materials.
- Occupational exposure: Firefighters and workers in fluorochemical manufacturing face substantially higher exposure.
PFAS are not absorbed significantly through skin during bathing or showering, which is why point-of-use treatment at the kitchen tap addresses most of the drinking water risk without whole-house treatment.
Health Risks
Research associates PFAS exposure with a range of effects. The strength of evidence varies by compound and endpoint, and is strongest for the long-studied compounds PFOA and PFOS:
- Immune effects, including reduced antibody response to vaccination in children — among the more consistently observed findings.
- Elevated cholesterol.
- Liver effects, including altered liver enzymes.
- Developmental effects, including reduced birth weight.
- Thyroid effects.
- Certain cancers: the International Agency for Research on Cancer classifies PFOA as carcinogenic to humans and PFOS as possibly carcinogenic, with kidney and testicular cancer the most studied associations for PFOA.
PFAS persist in the human body for years, so exposure accumulates. Infants, young children, and pregnant women are generally considered more susceptible, which is reflected in how health-based values are derived.
Identifying Contamination
The Investigation Sequence
- Sample source water and finished water using EPA Method 533 or 537.1 at a certified laboratory, with PFAS-specific sampling precautions.
- Review land use history within the source water area — airports, military sites, fire training grounds, industrial facilities, landfills, and biosolids application.
- Examine the PFAS profile, since the mixture of compounds indicates likely source types.
- Where attribution matters, extend to isomer profiling and precursor analysis.
- Establish whether concentrations are stable, rising, or falling through repeated sampling.
Why Detection Is Difficult
Regulatory limits are measured in parts per trillion, which places heavy demands on sampling and analysis. PFAS are present in many field materials — fluoropolymer equipment above all — so contamination during sampling is a constant risk, and field blanks are essential. Standard methods also measure only a few dozen of the thousands of PFAS that exist, so a clean result for the regulated compounds does not mean PFAS are absent.
The Regulatory Picture
EPA finalized enforceable drinking water limits in April 2024: 4.0 parts per trillion for PFOA and PFOS, with limits for PFHxS, PFNA, HFPO-DA, and a hazard index for mixtures, and compliance required by 2029. In May 2026, EPA proposed retaining the PFOA and PFOS limits with an optional extension to 2031 and rescinding the others; as of September 2026 these remain proposals.
Separately, EPA designated PFOA and PFOS as CERCLA hazardous substances in 2024, bringing PFAS contamination within the Superfund liability framework — significant for sites with identifiable responsible parties.
State requirements vary considerably. Several states set drinking water standards before federal action, some regulate compounds beyond the federal list, and others restrict PFAS in products or in biosolids land application. State requirements are frequently the binding constraint.
From Understanding to Response
Characterizing contamination properly shapes everything that follows. The PFAS profile determines which treatment technology suits, because short-chain compounds break through adsorptive media far sooner than long-chain ones. Source identification determines whether contamination is likely to worsen and whether costs may be recoverable. And exposure understanding determines what interim advice to give a community while a longer-term solution is built.
Where treatment is needed, the proven technologies are granular activated carbon, PFAS-selective anion exchange, and high-pressure membranes — set out for drinking water applications in our guide to drinking water PFAS removal systems and combined into working process configurations in our coverage of the PFAS treatment train. Where PFAS arrives at a wastewater plant, the constraints differ substantially, as discussed in our analysis of wastewater PFAS treatment.
One point deserves emphasis because it is widely misunderstood: conventional treatment — coagulation, filtration, chlorination — removes essentially no PFAS, and conventional advanced oxidation does not destroy it. A modern, well-run treatment plant without dedicated PFAS treatment provides no barrier.
Conclusion
PFAS contamination usually has a traceable origin: firefighting foam, fluorochemical manufacturing, industrial use, landfills, or land-applied biosolids. Understanding which applies tells you how the contamination will behave, what mixture of compounds to expect, and whether concentrations are likely to rise as precursors degrade.
That understanding is the foundation for everything else — treatment selection, exposure advice, cost recovery, and communication. Systems that invest in characterizing their contamination properly, including the compounds outside the regulated list, make better decisions than those that test only for what the rule requires and treat the result as the whole picture.