
Virginia Wastewater Treatment Plants
Introduction
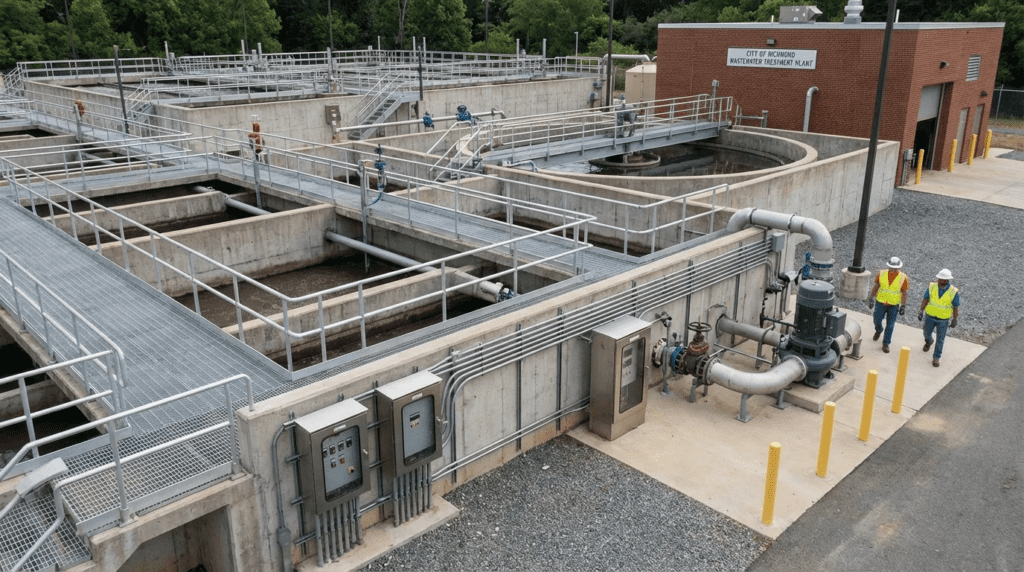
Virginia’s wastewater infrastructure represents some of the most advanced treatment technology in the United States, driven largely by the stringent nutrient reduction mandates of the Chesapeake Bay Preservation Act. With a growing population of over 8.7 million and a geography ranging from the tidal coastal plains to the mountainous Blue Ridge, the state’s engineering challenges are diverse.
The Commonwealth operates under the oversight of the Virginia Department of Environmental Quality (VADEQ). The defining characteristic of the sector in Virginia is the aggressive pursuit of Nitrogen and Phosphorus removal to protect the Chesapeake Bay watershed. This has necessitated the widespread adoption of Biological Nutrient Removal (BNR) and Enhanced Nutrient Removal (ENR) technologies across the state’s estimated 150+ major municipal discharge permit holders.
Currently, the state manages a total treatment capacity exceeding 600 MGD (Million Gallons per Day) across its major municipal facilities. The sector is currently undergoing a massive shift toward water reuse, spearheaded by the Hampton Roads Sanitation District’s (HRSD) SWIFT program and significant wet weather management programs in Richmond and Alexandria.
Among US wastewater treatment plants, Virginia’s are unusual in how their nutrient obligations are structured. Rather than each Bay watershed plant meeting an individual limit, dischargers operate under a watershed general permit with aggregate wasteload allocations and a functioning credit exchange, so a facility can comply by buying reductions another plant achieved. The state also cost-shared the upgrade wave that made this possible through the Water Quality Improvement Fund, which covered a large share of nutrient retrofit capital at municipal plants. The result is a state where compliance strategy is a portfolio question as much as a treatment question. This page indexes every Virginia facility profiled on the site within that framework.
Recent Developments & Market Outlook
In the last 24 months, Virginia has seen a surge in capital improvement projects driven by three primary factors: climate resilience/wet weather management, aquifer recharge, and aging infrastructure replacement.
The most significant development is the Sustainable Water Initiative for Tomorrow (SWIFT) managed by HRSD. This multi-billion-dollar initiative is converting wastewater to drinking water quality for injection into the Potomac Aquifer to combat land subsidence and saltwater intrusion. This positions Virginia as a global leader in indirect potable reuse (IPR) and advanced water treatment.
Simultaneously, the state is heavily leveraging federal funds. The Virginia Department of Health and VADEQ have mobilized substantial funding from the Infrastructure Investment and Jobs Act (IIJA) and American Rescue Plan Act (ARPA) to address rural sewer needs and urban Combined Sewer Overflow (CSO) abatement. Legislative deadlines set by the Virginia General Assembly have accelerated CSO remediation timelines for Alexandria (2025) and Richmond (2035), catalyzing nearly $1.5 billion in tunneling and plant expansion work.
Two further pressures are reshaping capital plans. Data center construction across Loudoun and Prince William counties has created demand for reclaimed water at a scale no Virginia utility previously planned for, turning purple pipe distribution from a conservation amenity into a revenue-generating service with committed offtake. And in Hampton Roads, relative sea level is rising faster than anywhere else on the Atlantic coast because regional land subsidence compounds it, which is pushing floodwall, pump station elevation, and electrical hardening into the base scope of plant upgrades rather than treating them as separate resilience projects.
Top 20 Largest Wastewater Treatment Plants in Virginia
The following ranking is based on permitted design capacity (MGD). Note: While the Blue Plains Advanced Wastewater Treatment Plant treats a significant volume of Northern Virginia’s wastewater, it is located in the District of Columbia and is excluded from this Virginia-sited list.
| Rank | Plant Name | City/Location | Design Capacity (MGD) | Population Served | Operating Authority |
|---|---|---|---|---|---|
| 1 | Noman M. Cole, Jr. Pollution Control Plant | Lorton | 67.0 | ~1.1 million | Fairfax County |
| 2 | Richmond WWTP (R. Byrd) | Richmond | 45.0 (70 Wet) | ~230,000 | City of Richmond (DPU) |
| 3 | Upper Occoquan Service Authority (UOSA) | Centreville | 54.0 | ~350,000 | UOSA |
| 4 | AlexRenew Water Resource Recovery Facility | Alexandria | 54.0 | ~300,000 | Alexandria Renew Enterprises |
| 5 | Nansemond Treatment Plant | Suffolk | 30.0 | Regional | HRSD |
| 6 | Virginia Initiative Plant | Norfolk | 40.0 | Regional | HRSD |
| 7 | Arlington Water Pollution Control Plant | Arlington | 40.0 | ~240,000 | Arlington County |
| 8 | Atlantic Treatment Plant | Virginia Beach | 54.0 | Regional | HRSD |
| 9 | Hopewell Regional Wastewater Treatment Facility | Hopewell | 50.0 | ~130,000 | Virginia American Water |
| 10 | Army Base Treatment Plant | Norfolk | 18.0 | Regional | HRSD |
| 11 | Moores Creek AWRRF | Charlottesville | 15.0 | ~110,000 | Rivanna Water & Sewer Authority |
| 12 | Roanoke Regional WPCP | Roanoke | 55.0 (Peak) | ~250,000 | Western Virginia Water Authority |
| 13 | Broad Run Water Reclamation Facility | Ashburn | 11.0 | Growing | Loudoun Water |
| 14 | Boat Harbor Treatment Plant | Newport News | 25.0 | Regional | HRSD |
| 15 | Chesapeake-Elizabeth Treatment Plant | Virginia Beach | 24.0 | Regional | HRSD |
| 16 | Aquia Wastewater Treatment Facility | Stafford | 10.0 | ~100,000 | Stafford County |
| 17 | H.L. Mooney Advanced Water Reclamation Facility | Woodbridge | 24.0 | ~300,000 | Prince William County Service Authority |
| 18 | Lynchburg Regional WWTP | Lynchburg | 22.0 | ~80,000 | Lynchburg Water Resources |
| 19 | James River Treatment Plant | Newport News | 20.0 | Regional | HRSD |
| 20 | Falling Creek WWTP | Chesterfield | 12.0 | ~100,000 | Chesterfield County Utilities |
Detailed Profiles of the Top 5 Largest Facilities
1. Noman M. Cole, Jr. Pollution Control Plant
The Fairfax County Noman M. Cole Jr. Pollution Control Plant in Lorton is the largest facility physically located in Virginia and the anchor of the county’s wastewater system.
- Location: Lorton, Fairfax County, VA
- Design Capacity: 67 MGD
- Current Average Flow: 42 MGD
- Operating Authority: Fairfax County Wastewater Management
- Receiving Water: Pohick Creek (Potomac River tributary)
Treatment Process: The Noman M. Cole plant utilizes advanced tertiary treatment. Processes include preliminary screening, primary clarification, activated sludge with biological nutrient removal (BNR), tertiary filtration (multimedia filters), and UV disinfection. It is one of the pillars of Chesapeake Bay protection in Northern Virginia.
Infrastructure & Innovation: The facility recently completed moving bed biofilm reactor (MBBR) pilots to enhance nitrogen removal efficiency. It employs anaerobic digestion for solids, with biogas utilized for on-site heating.
Compliance: Consistently achieves platinum-level compliance for NACWA Peak Performance awards. The plant operates under strict limits for Nitrogen (3 mg/L) and Phosphorus (0.18 mg/L).
2. Richmond Wastewater Treatment Plant (R. Byrd)
- Location: Richmond, VA
- Design Capacity: 45 MGD (Dry), 70 MGD (Wet Weather)
- Operating Authority: City of Richmond Department of Public Utilities
- Receiving Water: James River
Treatment Process: As a Combined Sewer System (CSS) facility, this plant is designed to handle massive hydraulic swings. It utilizes screening, grit removal, primary sedimentation, activated sludge for secondary treatment, and chlorination/dechlorination.
Notable Projects: The facility is the centerpiece of the “Clean River Project,” a massive initiative to reduce CSO events. The plant is currently undergoing upgrades to increase wet weather treatment capacity to reduce untreated overflows into the James River.
3. Upper Occoquan Service Authority (UOSA)
The Upper Occoquan Service Authority Regional Water Reclamation Plant is the oldest large-scale indirect potable reuse operation in the United States and remains the reference installation for the practice.
- Location: Centreville, VA
- Design Capacity: 54 MGD
- Operating Authority: UOSA (Joint Authority)
- Receiving Water: Occoquan Reservoir (Indirect Potable Reuse)
Treatment Process: UOSA is a world-renowned advanced water reclamation facility. It was one of the first major plants in the U.S. designed for indirect potable reuse. The process includes chemical clarification, two-stage recarbonation, multimedia filtration, Granular Activated Carbon (GAC) adsorption, and ion exchange for ammonium removal.
Infrastructure: The plant acts as a drought buffer for the Occoquan Reservoir, providing a significant portion of the drinking water supply volume during dry months.
4. AlexRenew Water Resource Recovery Facility
The Alexandria Renew Enterprises wastewater treatment plant operates on a dense urban site and is being reconfigured around the RiverRenew tunnel now coming online.
- Location: Alexandria, VA
- Design Capacity: 54 MGD
- Operating Authority: Alexandria Renew Enterprises
- Receiving Water: Hunting Creek (Potomac River)
Treatment Process: AlexRenew utilizes preliminary treatment, primary settling, and a biological nutrient removal system utilizing a distinct anammox bacteria sidestream treatment to reduce nitrogen efficiently. Disinfection is achieved via UV irradiation/pasteurization.
Recent Upgrades: The facility is currently integrating the massive RiverRenew tunnel system (see “Major Projects” below) to capture combined sewage and treat it before discharge.
5. HRSD Nansemond Treatment Plant
The HRSD Nansemond Wastewater Treatment Plant in Suffolk hosts the SWIFT Research Center and is where the district proved the advanced treatment train now being deployed across its system.
- Location: Suffolk, VA
- Design Capacity: 30 MGD
- Operating Authority: Hampton Roads Sanitation District (HRSD)
- Receiving Water: James River / Potomac Aquifer (via SWIFT)
Treatment Process: Nansemond is the pilot and primary site for the SWIFT Research Center. It utilizes a 5-step BNR process followed by the advanced SWIFT train: flocculation, ozonation, biologically active filtration (BAF), and granular activated carbon (GAC) before aquifer recharge.
Regional Facility Summaries
HRSD Virginia Initiative Plant (Rank 6): A 40 MGD facility in Norfolk utilizing a specific BNR configuration (the Virginia Initiative Plant process) developed by HRSD, serving as a model for biological phosphorus removal globally.
Arlington WPCP (Rank 7): Located in a dense urban footprint near the Pentagon, this 40 MGD plant has undergone extensive retrofitting to achieve state-of-the-art nutrient limits within a confined site.
Roanoke Regional (Rank 12): A 55 MGD (peak) facility serving the Blue Ridge region, critical for protecting the water quality of the Roanoke River and Smith Mountain Lake.
Virginia Treatment Plant Directory by Region
Virginia’s treatment capacity concentrates in three metropolitan clusters, and each faces a different version of the same Chesapeake Bay obligation. Northern Virginia discharges to the Potomac and its tributaries, with several plants meeting the tightest nutrient limits in the Commonwealth and one operating a drinking water reservoir as its receiving water. Hampton Roads discharges to the James, the Elizabeth, and the Atlantic through a single regional district, and is now redirecting a growing share of that flow underground into the Potomac Aquifer instead. Richmond and the middle James sit between them, with a combined sewer system and a legislative deadline. The listings below index every Virginia facility profiled on this site, grouped accordingly.
Northern Virginia and the Potomac
Northern Virginia’s plants carry the strictest nutrient limits in the state, in part because the receiving waters are small tributaries with limited assimilative capacity and in part because the region’s growth has been continuous for decades. Fairfax County, Alexandria, Arlington, Loudoun, and Prince William all operate their own facilities, while a substantial additional volume of Northern Virginia flow is treated across the river at Blue Plains under long-standing service agreements. That split ownership means regional capacity planning happens across a state line and through an interjurisdictional agreement rather than inside any single utility’s master plan.
Lower Potomac, historical identity. Our article on the Lower Potomac Wastewater Treatment Plant covers the Fairfax County facility under the name it carried for most of its operating life, before being renamed for Noman M. Cole Jr. The entry is useful for the plant’s earlier configuration and for the expansion history that took it to its current 67 MGD capacity. Readers researching the current operation should use the Lorton entry linked in the top-five profiles above; the two describe the same site at different points in its history.
Alexandria, pre-rebrand identity. Similarly, our article on the Alexandria Wastewater Treatment Plant covers the facility as it operated before the Alexandria Sanitation Authority became Alexandria Renew Enterprises. It documents the treatment train and the site constraints that shaped the plant’s development on a small urban parcel between Duke Street and Hunting Creek.
Arlington’s water pollution control plant, Loudoun Water’s Broad Run facility, the Prince William County H.L. Mooney plant, and Stafford County’s Aquia facility are not yet covered by individual articles on this site.
Hampton Roads
The Hampton Roads Sanitation District is the most consequential wastewater agency in Virginia and one of the more distinctive in the country. It operates a regional system across thirteen localities, developed the biological phosphorus removal configuration that carries the region’s name, and is now executing SWIFT, a program that treats effluent to drinking water standards and injects it into the Potomac Aquifer. SWIFT serves three purposes simultaneously: it replenishes an aquifer being depleted, it counteracts the land subsidence that makes local sea level rise worse than the global average, and it removes nutrient load from surface discharge, generating credits under the Bay allocation. Few programs anywhere solve a water supply problem, a geotechnical problem, and a nutrient compliance problem with the same infrastructure.
Virginia Initiative Plant, district view. A second article on the HRSD Virginia Initiative Plant in Norfolk covers the facility within the district’s system: its role in the Elizabeth River discharge, the biological nutrient removal process developed and demonstrated here, and its position in the SWIFT rollout sequence.
Boat Harbor, facility profile. The Boat Harbor Water Pollution Control Facility entry covers the Newport News plant’s treatment configuration and its discharge to the Hampton Roads harbor. The site is low-lying and tidally exposed, which has made flood protection and pump station reliability recurring capital items.
Boat Harbor, HRSD system view. A companion article on the HRSD Boat Harbor Treatment Plant in Newport News addresses the plant’s position in the district’s long-term consolidation planning, under which flow from this service area is intended to be redirected to a larger facility rather than the site being expanded in place. Consolidation of this kind is common in regional districts and changes the investment logic entirely: capital goes into conveyance and into the receiving plant rather than into the plant being retired.
Army Base Treatment Plant. The HRSD Army Base Treatment Plant in Norfolk is one of the district’s smaller facilities at roughly 18 MGD, serving a heavily industrialized and military-adjacent sewershed on the Elizabeth River. Influent character here differs from a purely residential service area, and the site’s elevation makes it one of the district’s more exposed assets to tidal flooding.
The district’s Atlantic, James River, Chesapeake-Elizabeth, York River, and Williamsburg facilities are not yet covered individually.
Richmond and the James
Richmond operates the state’s largest combined sewer system and is working under a General Assembly deadline to bring it under control by 2035. The wet weather design problem here is the familiar one for combined systems: a plant rated at 45 MGD dry weather must accept 70 MGD in storm conditions, and the difference between those numbers is where the capital goes. Surrounding counties operate separate systems and face a different problem entirely, namely growth.
Henrico County Water Reclamation Facility. The Henrico County Water Reclamation Facility serves the suburban county east and north of Richmond, discharging to the James River under Bay nutrient limits. Suburban county plants of this class occupy a useful middle position in the Virginia market: large enough to justify advanced nutrient removal and energy recovery, small enough that a single capital project can change the facility’s whole configuration. Chesterfield County’s Falling Creek and Proctors Creek facilities, on the opposite side of the river, are not yet covered on this site.
Shenandoah Valley, Southside, and Southwest Virginia
West of the Blue Ridge the picture changes. Shenandoah Valley plants discharge to tributaries of the Potomac and remain inside the Chesapeake Bay allocation despite being far from tidewater, which surprises operators moving into the region from elsewhere. Roanoke, Lynchburg, Danville, and the New River Valley discharge to the Roanoke, James, and New river systems and sit outside the Bay watershed, so their permits are driven by local water quality standards rather than by the Bay TMDL. Lynchburg carries a combined sewer obligation of its own, and Southwest Virginia’s small systems face the familiar rural problems of limited rate base and thin operator availability. None of these facilities is yet covered by individual articles on this site.
Plants with Approved Budgets & Expansion Projects
A. Major Projects Under Construction (2024-2026)
AlexRenew: RiverRenew Tunnel System
- Location: Alexandria, VA
- Project Scope: Construction of a 2-mile waterfront tunnel, diversion facilities, and pumping stations to mitigate CSOs.
- Total Budget: $615 Million
- Funding: WIFIA Loan ($321M), VPRA grants, Revenue Bonds.
- Timeline: Tunnel mining completed 2024; System online by July 2025.
- Key Contractors: Traylor-Shea (Design-Build).
- Drivers: State legislation requiring remediation of 4 major CSO outfalls by July 1, 2025.
HRSD: SWIFT (Sustainable Water Initiative for Tomorrow) – Full Scale
- Location: Multiple Sites (Nansemond, James River, etc.)
- Project Scope: Adding advanced water treatment facilities (AWT) to existing WWTPs to treat effluent to drinking water standards for aquifer injection.
- Total Budget: Est. $1.0 – $1.2 Billion (Program wide)
- Funding: EPA WIFIA Loans (multiple tranches), Clean Water SRF.
- Timeline: Ongoing through 2030.
- Technology: Ozone-BAF-GAC-UV.
- Drivers: Aquifer replenishment, subsidence prevention, nutrient credit generation.
Richmond: Interim Nutrient Reduction & CSO Control
- Location: Richmond, VA
- Project Scope: Upgrades to the R. Byrd plant to handle higher wet weather flows and reduce nutrient loads.
- Total Budget: Part of a larger $850M CSO plan.
- Funding: State appropriations ($100M+), SRF, Revenue Bonds.
- Timeline: Phased construction through 2035 (legislative deadline).
B. Projects in Design/Planning Phase (2025-2027)
- Loudoun Water – Broad Run WRF Phase 3 Expansion:
- Est. Budget: $150M+
- Scope: Capacity expansion to accommodate rapid data center and residential growth in Ashburn.
- Status: Planning/Design.
- Western Virginia Water Authority – Roanoke Biogas Upgrades:
- Est. Budget: $25M
- Scope: Enhancement of anaerobic digesters to produce renewable natural gas (RNG).
- Status: Engineering design.
Summary Statistics
- Total Active Capital Investment: >$2.4 Billion active in Virginia.
- Primary Project Drivers: 1. CSO Compliance (Richmond/Alexandria), 2. Water Reuse (HRSD), 3. Capacity for Growth (Loudoun/Stafford).
- Funding Source Breakdown: Strong reliance on WIFIA loans for mega-projects, supplemented by Virginia Clean Water Revolving Loan Fund (VCWRLF).
Regulatory & Compliance Landscape
Virginia’s regulatory environment is among the most sophisticated in the nation regarding nutrient management. The Chesapeake Bay TMDL (Total Maximum Daily Load) dictates strict waste load allocations for Nitrogen and Phosphorus. Many facilities operate under the Virginia Nutrient Credit Exchange Association, a market-based program that allows facilities to trade nutrient credits to maintain compliance efficiently.
Emerging Contaminants: VADEQ is currently monitoring PFAS (Per- and Polyfluoroalkyl Substances) across 40+ major wastewater plants. While strict effluent limits are not yet universal, many facilities (especially those with reuse permits like UOSA and HRSD) are preemptively evaluating removal technologies such as GAC and Ion Exchange.
The watershed general permit and how trading actually works
Virginia does something with Bay nutrients that most states do not. Rather than writing an individual nitrogen and phosphorus limit into each facility’s discharge permit and enforcing it plant by plant, the Commonwealth issues a watershed general permit that assigns each significant discharger a wasteload allocation and then allows compliance to be demonstrated in aggregate. A facility exceeding its allocation can acquire credits from a facility performing below its own, with the exchange administered through an association of the dischargers themselves.
Two consequences matter for project work. First, a plant’s permitted allocation is not necessarily its design target: a utility may deliberately overbuild to generate sellable credits, or deliberately underbuild and buy, and the decision is financial. Second, the aggregate structure means an individual plant’s apparent compliance margin tells you very little about whether an upgrade is coming. The trigger is more often a growth-driven allocation increase or a change in credit availability than an exceedance. Anyone forecasting the Virginia nutrient market from permit compliance data alone will read it wrong.
The Water Quality Improvement Fund
Virginia financed its nutrient upgrade wave differently from most Bay states. Through the Water Quality Improvement Fund, the Commonwealth provided grant cost-share, at times covering the substantial majority of eligible nutrient removal capital at municipal plants, rather than leaving the obligation entirely to local rate payers. That is why Virginia moved to enhanced nutrient removal across its major facilities faster than the funding capacity of individual utilities would suggest. It also means historical capital cost figures from Virginia plants can understate what an equivalent project costs a utility paying its own way, which is a trap when benchmarking across state lines.
SWIFT and nutrient credits
Water sent to the Potomac Aquifer is water not discharged to surface water, so every gallon SWIFT recharges reduces HRSD’s surface nutrient load and generates credit under the Bay allocation. This is what makes the program’s economics work: the aquifer replenishment and subsidence benefits are real but difficult to monetize directly, while nutrient credits and avoided future treatment obligations are quantifiable. Understanding that is essential to understanding why an agency would spend on advanced treatment for water it then puts underground.
Infrastructure Challenges & Opportunities
Workforce Development: Like many states, Virginia faces a “Silver Tsunami” of retiring Class I operators. This creates opportunities for automated SCADA solutions and third-party operations services.
Climate Resilience: The Hampton Roads region is ground zero for sea-level rise. WWTPs in Norfolk, Virginia Beach, and Newport News are investing heavily in floodwalls, elevated electrical substations, and pumping capacity to handle tidal inundation.
Data Center Growth: Northern Virginia (Data Center Alley) requires massive amounts of cooling water. This presents a lucrative market for reclaimed water systems (purple pipe) provided by utilities like Loudoun Water and UOSA.
Land subsidence compounds the coastal problem: Hampton Roads experiences relative sea level rise faster than the global average because the land itself is sinking, partly from post-glacial adjustment and partly from historical groundwater withdrawal. That is why aquifer recharge and flood resilience are treated as the same program rather than as separate ones, and why elevation and structural scope appear in plant upgrades here that would not appear at an equivalent facility on higher ground.
Regional consolidation: HRSD’s long-term planning contemplates retiring smaller treatment sites and conveying their flow to larger regional facilities. For suppliers and engineers this shifts opportunity from treatment equipment at the retiring site toward tunneling, pump stations, and force main work, and toward capacity additions at the receiving plant.
Technology Trends in Virginia
Virginia is a testbed for advanced technologies due to the Chesapeake Bay requirements:
- Nutrient Removal: Widespread use of 5-Stage Bardenpho, MLE, and IFAS (Integrated Fixed-Film Activated Sludge).
- Advanced Oxidation: High adoption of UV and Ozone, particularly in SWIFT projects.
- Energy Neutrality: Increasing installation of Combined Heat and Power (CHP) systems using digester gas (e.g., AlexRenew, Fairfax County).
- Trenchless Tech: Extensive use of tunnel boring machines (TBM) for conveyance projects in dense urban corridors like Alexandria.
- Deammonification and sidestream nitrogen treatment: Anammox-based sidestream processes applied to digester centrate, removing a recycle load that would otherwise consume mainstream aeration and nitrogen removal capacity.
- Biologically active filtration: Ozone followed by BAF and granular activated carbon, the backbone of the SWIFT train and an approach that avoids the concentrate stream a membrane-based purification train would produce.
- Managed aquifer recharge: Deep well injection into a confined aquifer, with the well field, monitoring network, and geochemical compatibility work forming a discipline distinct from the treatment plant that feeds it.
Comparing Virginia Facility Classes
Virginia facilities sort by receiving water, by whether they sit inside the Bay watershed, and by whether their system is combined or separate. The table below summarizes how those classes differ.
| Facility Class | Representative Plants | Typical Capacity | Receiving Water | Nutrient Regime | Primary Design Driver |
|---|---|---|---|---|---|
| Northern Virginia tributary discharger | Fairfax County Noman M. Cole Jr. Pollution Control Plant, Lower Potomac Wastewater Treatment Plant | 50-70 MGD | Small Potomac tributaries | Tightest limits in state; TN near 3 mg/L | Low assimilative capacity, continuous growth |
| Indirect potable reuse facility | Upper Occoquan Service Authority Regional Water Reclamation Plant | ~54 MGD | Occoquan Reservoir (drinking water) | Drinking water criteria govern, not permit limits | Reservoir protection, drought supply reliability |
| Urban combined sewer plant | Richmond R. Byrd, Alexandria Renew Enterprises plant and Alexandria Wastewater Treatment Plant | 45-54 MGD dry, higher wet | James River, Hunting Creek | Bay allocation plus CSO deadlines | Wet weather capture, legislative compliance dates |
| Regional district plant with aquifer recharge | HRSD Nansemond Wastewater Treatment Plant, HRSD Virginia Initiative Plant | 30-40 MGD | James and Elizabeth Rivers, plus Potomac Aquifer | Credits generated by diverting flow underground | SWIFT integration, subsidence, credit value |
| Coastal district plant facing consolidation | Boat Harbor Water Pollution Control Facility, HRSD Boat Harbor Treatment Plant, HRSD Army Base Treatment Plant | 18-25 MGD | Hampton Roads harbor, Elizabeth River | Bay allocation, district-wide | Tidal flooding, conveyance to receiving plants |
| Suburban county plant | Henrico County Water Reclamation Facility | 10-45 MGD | James River | Bay allocation with trading available | Growth capacity, nutrient removal, energy recovery |
Benchmarking and Site Selection
A state directory gets used to size a market, to find a comparable facility for a design or bid basis, and to anticipate permit requirements. In Virginia all three start with the Bay allocation and the funding history.
Selecting a comparable facility
Match on watershed first. A plant inside the Chesapeake Bay drainage operates under an aggregate allocation with trading available; a plant on the Roanoke or the New faces conventional individual limits set by local water quality standards. Then check whether the comparable is combined or separate sewer, because a combined system’s wet weather capacity dominates its capital profile in a way that has nothing to do with treatment quality. For coastal facilities, add elevation and flood exposure as a third filter, since resilience scope in Hampton Roads regularly rivals process scope.
Worked example: sizing a comparison set
Suppose a suburban county utility needs a benchmark for a 20 MGD enhanced nutrient removal upgrade inside the Bay watershed on a separate sewer system. Filtering by watershed and sewer type eliminates Richmond and Alexandria, whose costs are dominated by combined sewer work, and eliminates Roanoke and Lynchburg, which sit outside the Bay allocation. What remains is the Henrico, Chesterfield, Stafford, and Prince William group. Two adjustments follow. Confirm how much of each comparable’s capital was covered by Water Quality Improvement Fund grants, because a project that was heavily cost-shared will show a local cost far below the true project value. And check whether the utility bought nutrient credits to reduce the physical scope of its upgrade, since a plant that traded its way partway to compliance built a smaller facility than the allocation alone would imply.
Comparing Virginia to other state markets
Virginia’s approach is one of several within a single shared watershed, which makes neighboring directories unusually useful here. The Maryland wastewater treatment plants directory covers the closest comparison: the same Bay TMDL, a similar enhanced nutrient removal program, and a state that financed its upgrades through a dedicated restoration fee rather than through grant cost-share, producing a different cost picture for equivalent work. The District of Columbia wastewater treatment plants directory covers Blue Plains, which treats a large share of Northern Virginia’s flow under interjurisdictional agreements and is the single largest advanced treatment facility in the Bay watershed. The North Carolina wastewater treatment plants directory covers the adjacent coastal plain market, where nutrient management is organized around individual estuary basins such as the Neuse and the Tar-Pamlico rather than around a single multi-state TMDL.
Field Notes
Compliance margin does not predict projects here
Because Bay dischargers comply in aggregate and can buy credits, a Virginia plant running comfortably inside its allocation may still be planning an upgrade, and a plant apparently over its allocation may have no project at all. The signals that actually precede capital work are growth-driven allocation increases, credit price movement, and Water Quality Improvement Fund appropriation cycles. Reading Virginia’s nutrient market from discharge monitoring reports alone will produce a misleading pipeline.
Two names, one plant
Several Virginia facilities have been renamed, in some cases twice, as authorities rebranded or as plants were dedicated to individuals. The Fairfax County plant at Lorton and the Alexandria facility are both documented on this site under old and current names. When comparing capacities or capital histories across sources, verify that two entries are not the same asset before treating them as separate data points, particularly in Northern Virginia where this is common.
Pro Tip
For any Hampton Roads project, ask whether the site appears in HRSD’s long-term consolidation planning before pricing treatment equipment. Where a plant is slated to have its flow redirected to a larger facility, the capital going into that site is limited to what keeps it running until the conveyance is built, and the real opportunity sits in the tunnel, the pump stations, and the expansion of the receiving plant. Proposing a major process upgrade at a facility with a retirement horizon is a common way to waste a bid cycle.
Common Mistake
Assuming the Blue Ridge is the boundary of the Bay watershed. Shenandoah Valley plants discharge to Potomac tributaries and sit fully inside the Chesapeake Bay allocation despite being roughly 150 miles from tidewater, while Roanoke and Lynchburg, further south and east in places, drain to the Roanoke and James systems outside it. Watershed boundaries in Virginia do not follow the geography anyone would guess from a road map, and a nutrient value proposition pitched on location rather than on drainage will land wrong.
Permitting & Design Standards Reference
VADEQ administers discharge permitting, with the Bay nutrient obligation handled through a separate general permit and the Virginia Department of Health holding authority over reuse.
Discharge permitting in Virginia is administered by the Department of Environmental Quality under the Virginia Pollutant Discharge Elimination System. Nitrogen and phosphorus obligations for Chesapeake Bay watershed dischargers are established through a separate watershed general permit with assigned wasteload allocations and an associated nutrient credit exchange. Water reclamation and reuse are governed by the Virginia Water Reclamation and Reuse Regulation, with the Virginia Department of Health holding authority where reclaimed water affects a potable supply.
Specification checklist for a Virginia project
- Determine whether the facility drains to the Chesapeake Bay watershed and obtain its assigned wasteload allocation.
- Establish whether nutrient credits are being purchased or generated, and how that changes the required physical treatment capacity.
- Confirm whether the collection system is combined or separate, and obtain any legislative CSO deadline that applies.
- Establish design average and peak wet weather flow separately, and confirm which governs each unit process.
- For coastal sites, obtain design flood elevation, tidal exposure, and subsidence rate, and confirm resilience scope is in the base project.
- Check whether the site appears in a regional consolidation plan before scoping treatment upgrades.
- If reuse or aquifer recharge is contemplated, establish the applicable reuse regulation category and whether Virginia Department of Health review applies.
- For recharge projects, confirm geochemical compatibility with the receiving aquifer and the monitoring well network required.
- Verify Water Quality Improvement Fund eligibility and appropriation status, since grant cost-share materially changes project feasibility.
- Characterize industrial and institutional contribution, including military installations, which are significant contributors in several Hampton Roads sewersheds.
- For Northern Virginia, confirm whether any portion of the service area’s flow is treated under an interjurisdictional agreement at Blue Plains.
- Establish biosolids end use and land application availability, including haul distance.
- Verify operator licensure class requirements for the facility under Virginia rules.
- Confirm Virginia Clean Water Revolving Loan Fund or WIFIA participation and the conditions attached.
Resources for Engineers & Operators
- Virginia Water Environment Association (VWEA) – Primary industry group for networking and conferences (WaterJAM).
- Virginia DEQ Water Division – Permitting and compliance data.
- Virginia Water and Waste Authorities Association – Utility management resources.
- Virginia Clean Water Revolving Loan Fund – Funding information.
- Virginia Nutrient Credit Exchange Association – Administers credit trading among Bay watershed dischargers.
- Chesapeake Bay Program – Watershed implementation plan documentation and load tracking.
- Virginia Department of Health, Office of Drinking Water – Authority over reuse affecting potable supplies.
- Virginia Water Quality Improvement Fund – Grant cost-share for nutrient removal projects.
FAQ
- What is the largest wastewater treatment plant in Virginia?
- The Noman M. Cole, Jr. Pollution Control Plant in Fairfax County is the largest by design capacity located physically within Virginia, at 67 MGD.
- What is the HRSD SWIFT program?
- SWIFT (Sustainable Water Initiative for Tomorrow) is an innovative water reuse program by HRSD to treat wastewater to drinking water standards and recharge the Potomac Aquifer to prevent land subsidence.
- Are there CSO communities in Virginia?
- Yes, primarily Richmond, Lynchburg, and Alexandria. All are currently under strict state legislative mandates to remediate their combined sewer overflows by specific deadlines (2025-2035).
- What nutrient limits do Virginia plants face?
- Limits vary by watershed, but major plants often face Total Nitrogen limits of 3.0-4.0 mg/L and Total Phosphorus limits of 0.18-0.30 mg/L to protect the Chesapeake Bay.
- How much is Virginia investing in wastewater infrastructure?
- Current active major capital projects exceed $2.4 billion, largely driven by the RiverRenew project ($615M), Richmond CSO work ($800M+ long term), and the HRSD SWIFT program ($1B+).
- How does nutrient credit trading work in Virginia?
- Chesapeake Bay watershed dischargers operate under a watershed general permit that assigns each facility a nitrogen and phosphorus wasteload allocation, then permits compliance to be demonstrated in aggregate. A facility discharging above its allocation acquires credits from one performing below its own, through an exchange administered by an association of the dischargers. The practical effect is that a utility can choose between building treatment capacity and buying reductions, and the choice is a financial comparison rather than a purely engineering one. It also means a plant’s compliance status is a poor predictor of whether an upgrade is planned.
- Why does HRSD inject treated water into an aquifer instead of discharging it?
- SWIFT addresses three problems with one program. The Potomac Aquifer has been drawn down by decades of withdrawal, and recharging it restores a regional supply. Land subsidence caused partly by that withdrawal makes relative sea level rise in Hampton Roads worse than the global average, and putting water back slows it. And water sent underground is water not discharged to surface waters, which reduces HRSD’s nutrient load under the Bay allocation and generates credits. The nutrient benefit is the piece that makes the economics work, since aquifer and subsidence benefits are real but harder to monetize.
- Why do some Virginia plants face much tighter limits than others of the same size?
- Two factors. Facilities inside the Chesapeake Bay watershed carry nitrogen and phosphorus allocations that facilities on the Roanoke, New, or other non-Bay systems do not. And within the Bay watershed, plants discharging to small tributaries with limited assimilative capacity receive tighter limits than plants of the same size discharging to tidal waters. A 50 MGD plant on a Northern Virginia creek and a 50 MGD plant on the tidal James can face materially different requirements for the same parameter.
- Is Northern Virginia’s wastewater treated in Virginia?
- Only partly. Fairfax County, Alexandria, Arlington, Loudoun, and Prince William operate their own facilities, but a substantial volume of Northern Virginia flow is conveyed across the Potomac to Blue Plains in the District of Columbia under long-standing interjurisdictional agreements, with Virginia jurisdictions holding capacity rights there. Any regional capacity analysis that counts only Virginia-sited plants will understate the treatment serving the Northern Virginia population.
Key Takeaways
- Bay compliance is a portfolio decision, not just a treatment one — aggregate allocations and a working credit exchange let utilities choose between building and buying.
- State grant cost-share distorts historical cost data — Water Quality Improvement Fund support means Virginia capital figures can understate what the same project costs elsewhere.
- SWIFT works because of nutrient credits — aquifer recharge and subsidence benefits are real, but the credit value is what makes advanced treatment for injected water pencil out.
- Watershed boundaries do not follow intuition — Shenandoah Valley plants sit inside the Bay allocation; Roanoke and Lynchburg do not.
- Consolidation redirects opportunity — where HRSD plans to retire a site, the capital moves to conveyance and to the receiving plant.
- Renamed plants create double counting — several Virginia facilities appear under two names; verify before treating them as separate assets.
Conclusion
Virginia has spent two decades building the most institutionally sophisticated nutrient program in the Chesapeake Bay watershed, combining aggregate allocations, a functioning credit market, and state grant cost-share that carried much of the capital burden. The result is a sector where a plant’s upgrade path is determined as much by allocation growth and credit availability as by anything happening in its aeration basins. Layered on top of that, HRSD has built a reuse program that solves a supply problem, a subsidence problem, and a compliance problem with the same infrastructure, and Alexandria and Richmond are working through combined sewer obligations under dates set by the General Assembly rather than by a consent decree.
Use this directory as an index organized around those drivers. Start from the watershed and the sewer system type, establish whether credits are in play and how the project is being financed, and only then compare capacity and cost. The regional listings above link to detailed profiles of every Virginia facility covered on this site, and the cross-state comparisons help separate a Chesapeake Bay obligation from a Virginia policy choice.