Centrifugal Pumps Lifecycle Cost: CAPEX vs OPEX and Energy Payback
Introduction
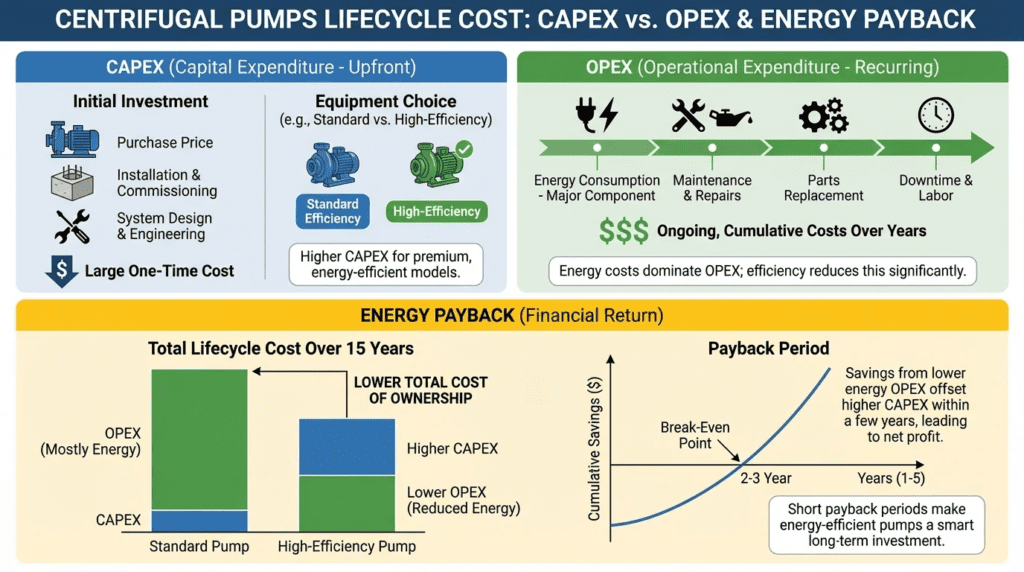
In municipal water treatment and industrial wastewater applications, the sticker price of rotating equipment is frequently the least significant number on the specification sheet. A surprising industry statistic often cited by the Hydraulic Institute reveals that initial purchase price typically accounts for less than 15% of a pump’s total lifecycle cost (LCC), while energy consumption and maintenance can exceed 85%. Yet, due to budget constraints and low-bid procurement mandates, engineers and plant managers are often forced into decisions that prioritize short-term capital savings over long-term operational solvency.
The failure to accurately model Centrifugal Pumps Lifecycle Cost: CAPEX vs OPEX and Energy Payback leads to systems that are inexpensive to build but financially draining to operate. For a 100 HP wastewater pump running continuously, a 2% drop in wire-to-water efficiency can cost a utility over $20,000 in excess electricity over a 20-year lifespan—often exceeding the original cost difference between a standard and a premium efficiency unit.
This article provides a rigorous engineering framework for analyzing lifecycle costs. It moves beyond basic pump curves to examine the intersection of hydraulic efficiency, material longevity, and maintenance intervals. We will explore how to specify equipment that balances Capital Expenditure (CAPEX) with Operating Expenditure (OPEX), ensuring that municipal and industrial facilities are designed for financial sustainability and mechanical reliability.
How to Select / Specify for Lifecycle Value
Selecting pumping equipment for optimal LCC requires a shift in mindset from “meeting the duty point” to “optimizing the operating envelope.” The following criteria are essential for specifying engineers aiming to minimize total cost of ownership (TCO) concerning Centrifugal Pumps Lifecycle Cost: CAPEX vs OPEX and Energy Payback.
Duty Conditions & Operating Envelope
The most critical driver of OPEX is the match between the pump’s hydraulic design and the system’s actual demand. Pumps are often sized for a theoretical “worst-case” scenario (Maximum Day Demand plus a safety factor), yet they operate 95% of the time at average daily flows.
- Best Efficiency Point (BEP): Specifications must require that the pump’s BEP aligns closely with the most frequent operating point, not just the maximum design condition. Operating significantly to the left of BEP (low flow) increases radial loads, reducing seal and bearing life (increasing maintenance costs).
- Preferred Operating Region (POR): Define the POR as 70% to 120% of BEP. Specifications should penalize selections where normal operation falls outside this range.
- Variable Speed Operation: If the static head is low relative to friction head, variable frequency drives (VFDs) offer massive energy payback. However, in high static head applications (e.g., pumping up a steep hill to a tank), VFDs may force the pump to run at lower efficiencies. LCCA calculations must verify the energy savings against the VFD CAPEX and cooling requirements.
Materials & Compatibility
Material selection is a direct trade-off between CAPEX and Maintenance OPEX. While upgrading metallurgy increases upfront costs, it dramatically extends the Mean Time Between Failures (MTBF) in aggressive fluids.
- Abrasion Resistance: In grit-heavy wastewater or sludge applications, standard cast iron volutes may wash out in 3-5 years. Specifying High-Chrome iron (28% Chrome) or hardened materials increases CAPEX by 30-50% but can extend wet-end life by 200-300%, offering a positive ROI within the first replacement cycle.
- Corrosion Resistance: For industrial wastewater with variable pH, standard 316 Stainless Steel is the baseline. However, moving to Duplex Stainless Steel (CD4MCu) provides superior pitting resistance and strength, allowing for thinner castings and potentially higher hydraulic efficiency, influencing the Centrifugal Pumps Lifecycle Cost: CAPEX vs OPEX and Energy Payback equation positively.
- Wear Rings: Specify dual-hardness wear rings (e.g., stainless stationary ring against a softer bronze or composite rotating ring) to prevent galling and allow for tighter clearances, preserving efficiency over time.
Hydraulics & Process Performance
Energy cost is a function of flow, head, and efficiency. The “Wire-to-Water” efficiency (combining pump, motor, and drive efficiency) is the metric that matters for the utility bill.
- NPSH Margin: A pump specified with insufficient Net Positive Suction Head (NPSH) margin will suffer from cavitation damage. This does not just cause noise; it erodes impellers, destroying hydraulic efficiency and necessitating premature replacement. A margin of 1.2 to 1.5 times NPSH3 is recommended for long-term reliability.
- Steep vs. Flat Curves: In systems where head varies (e.g., tank filling or variable groundwater levels), a steep head-capacity curve provides more stable control and prevents the pump from “running out” to high flow/high amp conditions, protecting the motor.
Installation Environment & Constructability
The physical configuration impacts both initial civil costs (CAPEX) and long-term serviceability (OPEX).
- Submersible vs. Dry Pit: Submersible pumps generally lower civil CAPEX by eliminating the dry well structure. However, dry pit pumps (or dry-pit submersibles) offer superior access for maintenance personnel, reducing labor hours for inspection and repair.
- Space Constraints: Vertical inline or vertical turbine pumps save floor space (civil cost) but may require crane access for motor removal (maintenance constraint).
- Piping Configuration: Poor inlet piping design (e.g., elbows too close to the suction flange) creates pre-swirl, reducing efficiency and bearing life.
Reliability, Redundancy & Failure Modes
Unplanned downtime is the most expensive form of OPEX. Redundancy strategies affect CAPEX linearly but reduce risk exponentially.
- MTBF Data: Engineers should request MTBF data for critical components like mechanical seals and bearings at the specified duty point. L-10 bearing life should be specified at a minimum of 50,000 hours, with 100,000 hours preferred for critical continuous duty stations.
- Seal Monitoring: In submersible applications, moisture detection sensors in the seal chamber and stator housing are mandatory. These inexpensive sensors (low CAPEX) prevent catastrophic motor failure (massive OPEX).
Lifecycle Cost Drivers
To accurately calculate Centrifugal Pumps Lifecycle Cost: CAPEX vs OPEX and Energy Payback, the engineer must quantify the following:
- Energy Consumption ($C_e$): Calculated based on weighted average operating hours at various flow rates.
- Maintenance Labor ($C_m$): Estimated hours for preventative maintenance (packing adjustment, lubrication) and corrective maintenance (seal replacement).
- Downtime Costs ($C_s$): The cost of lost production (industrial) or bypass pumping/tankering (municipal) during failure events.
- Disposal/Decommissioning ($C_d$): Often overlooked, but significant for large equipment containing oil or hazardous materials.
Comparison Tables
The following tables provide a comparative analysis to assist engineers in evaluating pump technologies and operational scenarios. Table 1 focuses on the trade-offs between different pump architectures regarding CAPEX and OPEX. Table 2 provides an application matrix to help identify the best fit for specific hydraulic scenarios.
| Pump Architecture | Typical CAPEX Profile | Energy Efficiency Potential (OPEX) | Maintenance Access (OPEX Driver) | LCC Best Fit Application |
|---|---|---|---|---|
| ANSI B73.1 End Suction | Low/Moderate Standardized dimensions lower manufacturing cost. |
Moderate/High Open impellers maintain efficiency if clearance is adjusted. |
Excellent Back pull-out design allows maintenance without disturbing piping. |
Chemical metering, industrial process water, light slurry. |
| Axially Split Case (Double Suction) | High Complex casting, two sets of bearings/seals. |
Very High Balanced axial loads and double suction eye maximize hydraulic efficiency. |
Good Top casing removal allows access to rotating assembly without removing motor. |
High-flow municipal distribution, cooling towers, raw water intake. |
| Submersible Solids Handling | Moderate Includes specialized motor; civil savings offset equipment cost. |
Moderate Hydraulics compromised slightly for solids passage. Motor cooling efficiency varies. |
Poor/Moderate Requires lifting equipment (hoist/crane) to access. Visual inspection impossible while running. |
Raw sewage lift stations, stormwater, deep wet wells. |
| Vertical Turbine | High Custom column lengths and bowl assemblies. |
High Multi-stage design allows precise head matching. |
Poor Requires significant headroom and crane to pull column/bowls for service. |
Deep wells, high-pressure booster service, limited floor space. |
| Self-Priming Centrifugal | Moderate/High Complex volute casting. |
Low/Moderate Recirculation porting reduces overall hydraulic efficiency. |
Excellent Located above grade; easy access to impeller and check valve. |
Suction lift applications, bypass pumping, dirty water with entrained air. |
| Application Scenario | Primary Constraint | Recommended Drive Strategy | LCC Priority Focus | Energy Payback Period (Typical) |
|---|---|---|---|---|
| Constant Flow / Constant Head (e.g., Transfer to EQ Tank) |
Single Duty Point | Fixed Speed (Soft Start) | Maximize Impeller Efficiency (Trim to point) | N/A (Base Case) |
| Variable Flow / Low Static Head (e.g., Closed Loop Circulation) |
Friction Losses Dominant | Variable Frequency Drive (VFD) | Part-load Efficiency (Wire-to-Water) | 0.5 – 2 Years Excellent ROI due to affinity laws. |
| Variable Flow / High Static Head (e.g., Lift Station to force main) |
Overcoming Elevation | VFD (Speed Limited) or Parallel Staging | System Control Logic & VFD Tuning | 3 – 5 Years Diminishing returns if speed drops below static head requirement. |
| High Grit / Abrasive Service (e.g., Grit Chamber, Sludge) |
Component Wear | Belt Drive (Speed reduction) or VFD | Material Hardness & Low Tip Speed | 1 – 3 Years ROI driven by reduced parts replacement, not just energy. |
Engineer & Operator Field Notes
Real-world experience often diverges from the theoretical calculations in the design phase. The following notes address practical aspects of managing Centrifugal Pumps Lifecycle Cost: CAPEX vs OPEX and Energy Payback in the field.
Commissioning & Acceptance Testing
Commissioning is the baseline for all future LCC tracking. Without a verified starting point, energy degradation cannot be measured.
- Hydraulic Verification: Do not rely solely on the factory acceptance test (FAT). Site conditions (piping geometry) affect performance. Verify flow and head at the site to establish the actual operating curve.
- Wire-to-Water Efficiency Calculation: During startup, measure input kW relative to hydraulic output power (Flow x Head). A discrepancy of more than 5% from the submitted curve indicates potential installation issues (e.g., air entrainment, misalignment, or voltage imbalance) that will bleed OPEX for decades.
- Vibration Baseline: Record full spectrum vibration signatures. High 1x RPM vibration often indicates impeller imbalance, while vane pass frequency vibration suggests hydraulic instability or operation away from BEP.
Pro Tip: The Cost of Safety Factors
Engineers often add safety factors to head calculations “just in case.” If a pump requires 80 ft of head but is specified for 100 ft, it will run out on its curve to find the intersection with the system curve. This results in higher flow, higher HP draw, and increased likelihood of cavitation. Oversizing is the silent killer of efficiency. It is often cheaper to VFD-limit an oversized pump than to throttle it with a valve, but the best LCC solution is a correctly sized pump.
Common Specification Mistakes
In the pursuit of reliable specifications, engineers sometimes inadvertently inflate costs or reduce reliability:
- Confusing Motor Service Factor: Relying on the 1.15 service factor for continuous operation is a mistake. Motors running into their service factor run hotter, reducing insulation life by 50% for every 10°C rise above rated temperature. Spec motors to operate below nameplate HP at the worst-case condition.
- Ignoring Net Positive Suction Head Available (NPSHa): Assuming “standard atmospheric pressure” at higher elevations leads to cavitation. Always calculate NPSHa based on the lowest possible water level and highest fluid temperature.
- Vague Material Specs: Specifying “Stainless Steel” is insufficient. 304 SS is inadequate for chlorides found in many wastewaters; 316L or Duplex should be the minimum standard to prevent crevice corrosion.
O&M Burden & Strategy
Operational strategies significantly influence the “Maintenance” variable in the LCC equation.
- Impeller Clearance Adjustment: For open or semi-open impellers, efficiency drops as the clearance between the impeller and liner increases due to wear. A maintenance protocol that includes checking and adjusting this clearance annually can restore efficiency and save 3-5% in energy costs.
- Lubrication Management: Over-greasing bearings is a common cause of failure (churning causing heat). Automatic greasers or strict adherence to volume-based relubrication schedules reduce bearing replacement frequency.
- Predictive vs. Reactive: Implementing vibration monitoring and oil analysis allows utilities to replace bearings before they fail catastrophically and damage the shaft or housing. This shifts maintenance from “Emergency Repair” (High Cost) to “Planned Maintenance” (Low Cost).
Troubleshooting Guide
When LCC spikes unexpectedly, investigate these common culprits:
- High Energy Bills: Check for a partially closed discharge valve (wasted energy) or wear ring degradation (internal recirculation). Also, verify check valves are not sticking open, causing backflow and re-pumping.
- Short Seal Life: Check for shaft deflection caused by operating too far from BEP. Also, verify flush plan operation—clogged flush lines in wastewater pumps quickly lead to seal face overheating.
- Noise/Vibration: Differentiate between cavitation (gravel sound), recirculation (random popping), and mechanical looseness (rhythmic clunking). Each has a different root cause and solution.
Design Details / Calculations
This section details the methodology for quantifying Centrifugal Pumps Lifecycle Cost: CAPEX vs OPEX and Energy Payback.
Sizing Logic & Methodology
The Hydraulic Institute and Europump provide the standard framework for LCC analysis. The total lifecycle cost ($LCC$) is the sum of all cost elements:
LCC = Cic + Cin + Ce + Co + Cm + Cs + Cenv + Cd
- Cic: Initial Cost (Pump, motor, accessories)
- Cin: Installation and Commissioning Cost
- Ce: Energy Cost (The largest component)
- Co: Operation Cost (Labor for normal system supervision)
- Cm: Maintenance and Repair Cost
- Cs: Downtime Cost (Loss of production)
- Cenv: Environmental Cost (Contamination, disposal fees)
- Cd: Decommissioning/Disposal Cost
Energy Cost Calculation ($Ce$)
To calculate the annual energy cost, use the following formula. This should be calculated for each distinct operating point if the flow varies.
$$ Cost_{annual} = frac{Q times H times SG}{3960 times eta_{pump} times eta_{motor} times eta_{drive}} times 0.746 times Hours times frac{$}{kWh} $$
Where:
- Q: Flow rate (GPM)
- H: Total Dynamic Head (Feet)
- SG: Specific Gravity (1.0 for water)
- 3960: Conversion constant for HP
- $eta$: Efficiency (decimal format) of pump, motor, and VFD
- 0.746: Conversion from HP to kW
Calculation Example
Scenario: A 50 HP pump running 4,000 hours/year at an electricity rate of $0.12/kWh.
Option A (Standard): 78% Pump Eff, 90% Motor Eff. System Eff = 0.702.
Option B (Premium): 82% Pump Eff, 94% Motor Eff. System Eff = 0.771.
Annual Cost Option A: ~$17,850
Annual Cost Option B: ~$16,250
Savings: $1,600/year.
Over 20 years, Option B saves $32,000 (ignoring inflation), justifying a significantly higher initial purchase price.
Specification Checklist
To ensure LCC is prioritized in the bid process, include these requirements:
- Guaranteed Efficiency: Require a certified curve with a guaranteed minimum efficiency at the duty point, with penalties for non-compliance.
- LCCA Bid Form: Require vendors to submit an LCCA worksheet populated with their specific efficiency data and recommended maintenance intervals. Evaluate bids based on Net Present Value (NPV), not just sticker price.
- Materials of Construction: Explicitly state ASTM grades for volutes, impellers, and shafts. Do not allow “manufacturer’s standard” without review.
- Testing Standards: Mandate testing per Hydraulic Institute (HI) 14.6 Acceptance Grade 1B or 1U for critical applications.
Frequently Asked Questions
What is the typical energy payback period for a Variable Frequency Drive (VFD)?
In variable flow applications, the energy payback period for a VFD is typically between 6 months and 2 years. By allowing the pump to follow the system curve without throttling valves, energy waste is minimized. However, in systems with high static head (lifting water vertically with little friction loss), VFDs offer less efficiency gain and the payback period may extend beyond 5 years or never be realized. Always analyze the system curve before specifying a VFD.
How does pump speed affect lifecycle cost?
Pump speed is inversely related to reliability. Doubling the speed (e.g., 1800 RPM to 3600 RPM) increases wear rates by a factor of four to eight, depending on the abrasive nature of the fluid. While 3600 RPM pumps are cheaper (smaller physical size for same HP), they typically incur significantly higher maintenance costs and shorter lifespans. For wastewater and industrial applications, 1800 RPM or lower is preferred to minimize OPEX.
Why is operating at the Best Efficiency Point (BEP) critical for LCC?
Operating at BEP minimizes hydraulic radial loads on the pump shaft. As operation shifts away from BEP (either flow extreme), shaft deflection increases, leading to premature seal failure, bearing fatigue, and increased vibration. A pump operating consistently at BEP may last 20 years, while the same pump operating at 40% of BEP may require major repairs every 3 years, drastically inflating the lifecycle cost.
Is it better to repair or replace an old centrifugal pump?
A general rule of thumb is that if the repair cost exceeds 50-60% of the cost of a new pump, replacement is advisable. However, LCC analysis adds another layer: if a new pump offers 5-10% better hydraulic efficiency (due to modern design or better sizing for current conditions), the energy savings often justify replacement even if the repair cost is low. Calculate the energy penalty of the old pump before deciding.
How do wear rings impact pump efficiency over time?
Wear rings separate the high-pressure discharge side from the low-pressure suction side of the impeller. As these rings wear, “recirculation” occurs, where pumped fluid leaks back to the suction side. Opening clearances by just double the factory spec can reduce pump efficiency by 3-5% or more. Replacing or upgrading wear rings is one of the most cost-effective maintenance actions to restore energy performance.
What is the role of Premium Efficiency Motors in LCC?
Premium efficiency (NEMA Premium or IE3/IE4) motors reduce electrical losses (heat) compared to standard motors. While the efficiency gain might seem small (e.g., 2-4%), for a motor running continuously, the ROI is usually under 18 months. Furthermore, premium motors typically run cooler, which extends insulation and bearing grease life, contributing to lower maintenance OPEX.
Conclusion
Key Takeaways: Lifecycle Cost Optimization
- Energy Dominates: Energy consumption typically accounts for 40-85% of total lifecycle cost; purchase price is often less than 15%.
- Right-Sizing is Critical: Oversizing pumps “for safety” pushes operation away from BEP, increasing energy use and maintenance frequency.
- Material Upgrades Pay Off: Investing in abrasion-resistant materials (e.g., High Chrome) or corrosion-resistant alloys (e.g., CD4MCu) increases CAPEX but significantly lowers maintenance OPEX in harsh environments.
- VFDs are not Magic: VFDs offer massive ROI in friction-dominated systems but require careful analysis in static-head dominated systems.
- Evaluated Bidding: Use Net Present Value (NPV) analysis in bid specifications to prevent low-CAPEX / high-OPEX equipment from winning tenders.
- Monitor to Manage: Establish a wire-to-water efficiency baseline at commissioning and track it to determine optimal maintenance intervals.
Optimizing Centrifugal Pumps Lifecycle Cost: CAPEX vs OPEX and Energy Payback requires a holistic engineering approach that transcends the initial purchase order. For municipal and industrial decision-makers, the goal is to procure performance and reliability over time, not just hardware. By rigorously analyzing duty cycles, selecting appropriate materials, avoiding oversizing, and prioritizing wire-to-water efficiency, engineers can design systems that deliver value for decades.
When specifications prioritize Total Cost of Ownership (TCO) over the lowest bid, the result is a resilient infrastructure that conserves budget resources, reduces energy footprint, and minimizes the burden on maintenance staff. The engineering math is clear: the cheapest pump to buy is rarely the cheapest pump to own.