Centrifugal Pumps Lifecycle Cost: CAPEX vs OPEX and Energy Payback
Introduction
In municipal water treatment and industrial wastewater applications, the sticker price of rotating equipment is frequently the least significant number on the specification sheet. Lifecycle cost guidance published jointly by the Hydraulic Institute and Europump makes the point directly: initial purchase price is usually a small fraction of a pump’s total cost of ownership, while energy and maintenance dominate. Yet because of budget constraints and low-bid procurement statutes, engineers and plant managers are often pushed into decisions that prioritize short-term capital savings over long-term operating solvency.
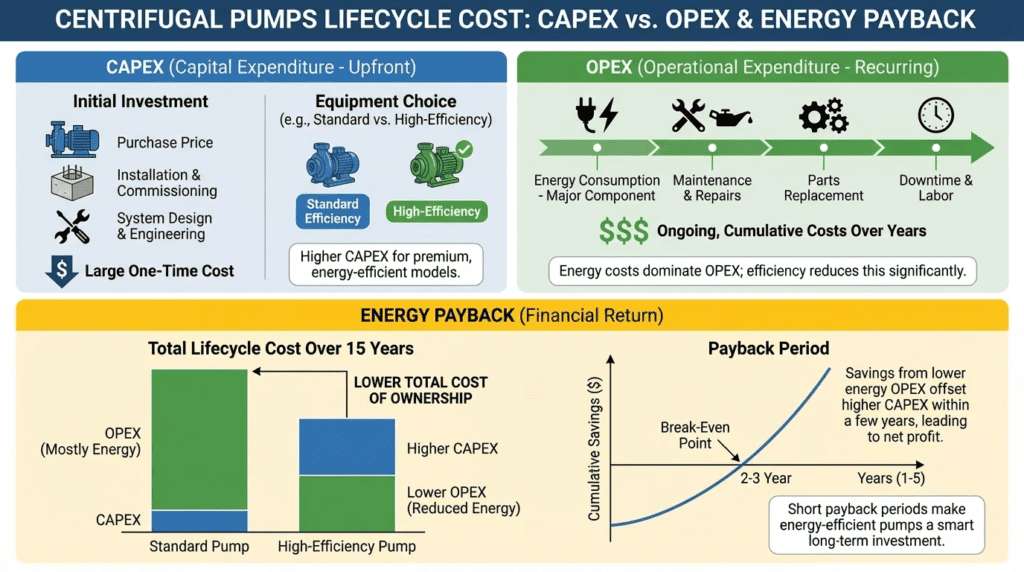
The failure to model Centrifugal Pumps Lifecycle Cost: CAPEX vs OPEX and Energy Payback produces systems that are inexpensive to build and expensive to run. The scale is easy to underestimate. Take a pump drawing roughly 75 kW continuously: a two-percentage-point loss in wire-to-water efficiency raises input power by about 2 kW, which over 20 years of continuous operation at $0.12/kWh is on the order of $40,000 in electricity for no additional water moved. That is frequently several times the price difference between a standard and a premium selection.
This article provides an engineering framework for analyzing lifecycle costs. It moves beyond pump curves to examine the intersection of hydraulic efficiency, material longevity, and maintenance intervals. Within the broader field of centrifugal pumps, lifecycle cost is the discipline that connects the equipment selection to the utility’s operating budget for the next two decades.
How to Select / Specify for Lifecycle Value
Selecting pumping equipment for optimal lifecycle cost requires a shift from “meeting the duty point” to “optimizing the operating envelope.”
Duty Conditions & Operating Envelope
The most important driver of operating cost is the match between the pump’s hydraulic design and actual demand. Pumps are often sized for a worst-case scenario plus a safety factor, then spend nearly all of their service life at average flows.
- Best Efficiency Point (BEP): Specifications should require that BEP align with the most frequent operating point, not the maximum design condition. Operating well to the left of BEP increases radial loads and shortens seal and bearing life.
- Preferred Operating Region (POR): The Hydraulic Institute defines the POR as approximately 70% to 120% of BEP flow. Specifications should penalize selections where normal operation falls outside it.
- Variable Speed Operation: Where static head is low relative to friction head, variable frequency drives deliver large energy savings. In high static head applications, reducing speed yields much less benefit because the pump must still generate the static lift before any flow occurs. Lifecycle analysis must verify the savings against drive capital cost, harmonic mitigation, and panel cooling.
Materials & Compatibility
Material selection is a direct trade-off between capital cost and maintenance cost. Upgrading metallurgy raises the purchase price and extends mean time between failures in aggressive fluids.
- Abrasion Resistance: In grit-heavy wastewater or sludge service, standard cast iron volutes can wash out within a few years. High-chrome iron raises capital cost materially but extends wet-end life substantially, often paying back within the first avoided replacement cycle. Quantify the trade using the plant’s own replacement history rather than a generic multiplier.
- Corrosion Resistance: For industrial wastewater with variable pH, 316 stainless steel is the baseline. Duplex grades such as CD4MCu provide superior pitting and chloride stress corrosion cracking resistance along with higher strength.
- Wear Rings: Specify renewable wear rings with dissimilar hardness between rotating and stationary components to prevent galling, so that tight clearances — and therefore efficiency — can be restored at overhaul rather than requiring casing replacement.
Hydraulics & Process Performance
Energy cost is a function of flow, head, and efficiency. Wire-to-water efficiency, combining pump, motor, and drive, is the figure that appears on the utility bill.
- NPSH Margin: A pump specified with insufficient NPSH margin will cavitate. This erodes impellers, destroys hydraulic efficiency, and forces premature replacement. Hydraulic Institute guidance gives margin ratios above NPSH required; a ratio in the range of 1.2 to 1.5 is commonly applied for continuous service, with higher values for high-energy pumps.
- Steep vs. Flat Curves: Where head varies, a steeper head-capacity curve gives more stable control and prevents the pump from running out to high flow and high power draw.
- Intake Conditions: Efficiency losses from poor approach hydraulics are permanent and compound every operating hour. This is why intake geometry belongs in the lifecycle analysis, as covered in the treatment of centrifugal pumps wet well design.
Installation Environment & Constructability
- Submersible vs. Dry Pit: Submersibles generally lower civil capital cost by eliminating the dry well structure. Dry pit installations offer better maintenance access, reducing labor hours for inspection and repair.
- Space Constraints: Vertical inline and vertical turbine pumps save floor space but may require crane access for motor removal.
- Piping Configuration: Elbows too close to the suction flange create pre-swirl, reducing efficiency and bearing life for the life of the installation.
Reliability, Redundancy & Failure Modes
- Bearing Life: Specify L10 bearing life of at least 50,000 hours, with 100,000 hours preferred for critical continuous duty.
- Seal Monitoring: In submersible applications, moisture detection in the seal chamber and stator housing is inexpensive insurance against catastrophic motor loss.
- Redundancy: Standby capacity raises capital cost roughly linearly while reducing the probability-weighted downtime cost disproportionately.
Lifecycle Cost Drivers
To calculate Centrifugal Pumps Lifecycle Cost: CAPEX vs OPEX and Energy Payback, the engineer must quantify energy consumption weighted across the actual duty cycle, maintenance labor for both preventive and corrective work, downtime cost including bypass pumping or tankering, and decommissioning or disposal.
The Discount Rate Decides the Answer
Lifecycle cost analysis fails in municipal procurement for a procedural reason more often than a technical one. The engineering is usually sound; what is missing is a mechanism that allows the evaluation to affect the award.
Start with the arithmetic that most LCC advocacy skips. Twenty years of $1,600 in annual savings is $32,000 in nominal dollars, and that number is what appears in most vendor comparisons. It is not the value of the savings. Discounted at 4%, the same stream is worth about $21,700 today; at 6%, about $18,400. Energy escalation pushes in the other direction, and if power prices rise faster than the discount rate the present value can exceed the nominal figure. The point is that the answer moves by 30% or more depending on two assumptions that are rarely stated, so both belong in the analysis explicitly: a discount rate taken from the utility’s own capital planning guidance, and an energy escalation rate that can be defended.
Then deal with the procurement mechanism, which is where the analysis usually dies. Most public agencies operate under statutes requiring award to the lowest responsible bidder. An LCC calculation prepared after bids open has no standing; it is an argument for disregarding the low bid, and it will lose. The analysis has to be converted into bid language before advertisement. Three approaches work in practice:
- Evaluated bid with an energy adder. The specification states that bids will be compared on the sum of the bid price plus the present value of energy consumption at a stated duty point, discount rate, escalation rate, operating hours, and power cost, computed from each bidder’s certified efficiency. Because every input is published in advance, the evaluation is objective and defensible.
- Minimum efficiency as a responsiveness requirement. Rather than evaluating efficiency, make it a pass-fail threshold at the duty point, backed by certified test data. This is simpler to administer but captures less value, since a bidder need only clear the bar.
- Performance guarantee with liquidated damages. The bidder certifies efficiency, witnessed testing verifies it, and a stated dollar amount per percentage point of shortfall applies. This addresses the real risk, which is optimistic curves rather than honest ones.
One caution on the first approach: the energy adder must be based on the weighted duty cycle, not the design point. Evaluating at peak flow rewards a pump optimized for a condition that occurs a few hours a year and can select against the pump that is more efficient where the station actually runs.
Comparison Tables
| Pump Architecture | Typical CAPEX Profile | Energy Efficiency Potential (OPEX) | Maintenance Access (OPEX Driver) | LCC Best Fit Application |
|---|---|---|---|---|
| ANSI B73.1 End Suction | Low/Moderate. Standardized dimensions lower manufacturing and replacement cost. | Moderate/High. Open impellers hold efficiency if clearance is maintained. | Excellent. Back pull-out design allows maintenance without disturbing piping. | Chemical transfer, industrial process water, light slurry. |
| Axially Split Case (Double Suction) | High. Complex casting, two bearing and seal sets. | Very High. Balanced axial loads and double suction maximize hydraulic efficiency. | Good. Top casing removal accesses the rotating assembly without removing the motor. | High-flow municipal distribution, cooling water, raw water intake. |
| Submersible Solids Handling | Moderate. Specialized motor; civil savings offset equipment cost. | Moderate. Hydraulics compromised for solids passage. | Poor/Moderate. Requires lifting equipment; no visual inspection while running. | Raw sewage lift stations, stormwater, deep wet wells. |
| Vertical Turbine | High. Custom column lengths and bowl assemblies. | High. Multi-stage design allows precise head matching. | Poor. Requires headroom and crane to pull the column. | Deep wells, high-pressure booster service, limited floor space. |
| Self-Priming Centrifugal | Moderate/High. Complex volute casting. | Low/Moderate. Recirculation porting reduces hydraulic efficiency. | Excellent. Above grade; easy access to impeller and check valve. | Suction lift applications, bypass pumping, water with entrained air. |
| Application Scenario | Primary Constraint | Recommended Drive Strategy | LCC Priority Focus | Energy Payback (Typical) |
|---|---|---|---|---|
| Constant Flow / Constant Head (transfer to equalization tank) |
Single duty point | Fixed speed with soft start | Maximize impeller efficiency; trim to the point | Not applicable (base case) |
| Variable Flow / Low Static Head (closed loop circulation) |
Friction losses dominant | Variable frequency drive | Part-load wire-to-water efficiency | Short. Strong return because power falls roughly with the cube of speed. |
| Variable Flow / High Static Head (lift station to force main) |
Overcoming elevation | Speed-limited VFD or parallel staging | Control logic and minimum speed limits | Longer. Returns diminish sharply as speed approaches the static head threshold. |
| High Grit / Abrasive Service (grit chamber, sludge) |
Component wear | Speed reduction by drive or belt | Material hardness and low tip speed | Moderate. Return driven by reduced parts replacement more than energy. |
Engineer & Operator Field Notes
Commissioning & Acceptance Testing
Commissioning establishes the baseline for all future lifecycle tracking. Without a verified starting point, efficiency degradation cannot be detected.
- Hydraulic Verification: Do not rely on the factory test alone. Site piping geometry affects performance. Verify flow and head at the site to establish the actual operating point.
- Wire-to-Water Calculation: During startup, measure input kilowatts against hydraulic output power. A material discrepancy from the submitted curve indicates an installation issue such as air entrainment, misalignment, or voltage unbalance that will bleed operating cost for decades.
- Vibration Baseline: Record full spectrum signatures. High 1x running speed vibration suggests imbalance; vane pass frequency content suggests hydraulic instability or operation away from BEP.
Pro Tip: The Cost of Safety Factors
Engineers add safety factors to head calculations as a matter of habit. If a pump needs 80 ft of head but is specified for 100 ft, it will run out along its curve to find the system curve intersection, producing higher flow, higher power draw, and greater cavitation risk. Trimming an oversized pump with a drive is better than throttling it with a valve, but a correctly sized pump beats both. Oversizing is the quiet destroyer of efficiency.
Common Specification Mistakes
- Relying on Motor Service Factor: Using the 1.15 service factor for continuous operation is a mistake. Motors running into the service factor run hotter, and insulation life roughly halves for every 10 °C rise above rated temperature. Specify motors to operate below nameplate at the worst-case condition.
- Ignoring NPSH Available: Assuming standard atmospheric pressure at elevation, or design-temperature fluid, leads to cavitation. Calculate NPSH available at the lowest level and highest fluid temperature.
- Vague Material Specs: “Stainless steel” is insufficient. 304 is inadequate for the chlorides in many wastewaters; 316L or duplex should be the minimum.
- No Evaluated Bid Provision: Preparing the lifecycle analysis without writing the evaluation method into the bid documents beforehand, which leaves the award to price alone.
O&M Burden & Strategy
- Impeller Clearance Adjustment: For open and semi-open impellers, efficiency falls as clearance opens through wear. Checking and adjusting clearance annually recovers a measurable share of that loss.
- Lubrication Management: Over-greasing is a common cause of bearing failure through churning and heat. Volume-based relubrication schedules or automatic lubricators reduce failures.
- Predictive vs. Reactive: Vibration monitoring and oil analysis allow bearings to be replaced before failure damages the shaft or housing, moving work from emergency repair to planned maintenance.
Troubleshooting Guide
- High Energy Bills: Check for a partially closed discharge valve, wear ring degradation causing internal recirculation, or a check valve stuck open allowing backflow and re-pumping.
- Short Seal Life: Check for shaft deflection from operating away from BEP, and verify the seal flush plan is functioning; clogged flush lines overheat seal faces quickly in wastewater.
- Noise and Vibration: Distinguish cavitation (a gravel-like sound), suction recirculation (irregular popping), and mechanical looseness (rhythmic knocking). Each has a different cause and remedy.
Design Details / Calculations
The Lifecycle Cost Framework
The Hydraulic Institute and Europump lifecycle cost framework expresses total cost as the sum of its elements:
LCC = Cic + Cin + Ce + Co + Cm + Cs + Cenv + Cd
- Cic: initial cost (pump, motor, accessories)
- Cin: installation and commissioning
- Ce: energy cost, typically the largest component
- Co: operation cost (normal supervision labor)
- Cm: maintenance and repair
- Cs: downtime cost
- Cenv: environmental cost, including disposal of process residuals
- Cd: decommissioning and disposal
Each element must be discounted to present value before the elements are summed. Adding an undiscounted 20-year energy stream to a capital cost paid on day one compares unlike quantities.
Energy Cost Calculation
Annual energy cost for a single operating point, in US customary units:
Annual cost = [ (Q × H × SG) ÷ (3960 × ηpump × ηmotor × ηdrive) ] × 0.746 × hours × rate
where Q is flow in gpm, H is total dynamic head in feet, SG is specific gravity, 3960 converts to water horsepower, the efficiency terms are decimals, 0.746 converts horsepower to kilowatts, hours is annual operating hours, and rate is the cost per kWh. Where flow varies, compute this for each distinct operating point and weight by the hours spent at each.
Worked Comparison
Basis: two candidate selections delivering the same hydraulic output — this is the essential condition, because comparing pumps at equal input power tells you nothing about efficiency. Hydraulic output is 26.2 kW (about 35 water horsepower); 4,000 operating hours per year; electricity at $0.12/kWh.
Option A: 78% pump efficiency × 90% motor efficiency = 70.2% wire-to-water. Input power = 26.2 ÷ 0.702 = 37.3 kW. Annual energy = 37.3 × 4,000 = 149,200 kWh = $17,900/year.
Option B: 82% pump × 94% motor = 77.1% wire-to-water. Input power = 26.2 ÷ 0.771 = 34.0 kW. Annual energy = 34.0 × 4,000 = 136,000 kWh = $16,320/year.
Annual saving: about $1,580. Nominal 20-year total: about $31,600. Present value at a 4% discount rate: about $21,500. At 6%: about $18,100. Any of these three figures may be the right one to use, but they are not interchangeable, and the discount rate must be stated alongside the result.
Specification Checklist
- Guaranteed Efficiency: require a certified curve with guaranteed minimum efficiency at the stated duty point, with remedies for non-compliance.
- Evaluated Bid Method: publish the duty cycle, operating hours, power cost, discount rate, escalation rate, and evaluation period in the bid documents, before advertisement.
- Lifecycle Worksheet: require vendors to submit an LCC worksheet populated with their own efficiency data and recommended maintenance intervals.
- Materials of Construction: state ASTM grades for volutes, impellers, and shafts. Do not accept “manufacturer’s standard” without review.
- Testing Standards: mandate testing per ANSI/HI 14.6 at an acceptance grade appropriate to the application, and require witnessed testing where an efficiency guarantee carries financial consequence.
Frequently Asked Questions
What is the typical energy payback period for a variable frequency drive?
In friction-dominated variable flow applications, payback is commonly well under two years, because power falls approximately with the cube of speed. In systems with high static head, a drive delivers much less benefit: the pump must still develop the static lift before producing any flow, so speed reduction is bounded and savings are modest. Payback in those cases can extend past five years or never be realized. Analyze the system curve before specifying a drive.
How does pump speed affect lifecycle cost?
Wear rates rise steeply with rotational speed, particularly in abrasive service, because erosion scales with a high power of particle velocity. A 3600 rpm pump is physically smaller and cheaper for a given power than an 1800 rpm pump, but it generally incurs higher maintenance cost and shorter wet-end life. For wastewater and abrasive industrial service, lower speed is usually the better lifecycle choice.
Why is operating at BEP critical for lifecycle cost?
BEP is where hydraulic radial load on the shaft is lowest. As operation moves away from BEP in either direction, shaft deflection increases, driving premature seal failure, bearing fatigue, and vibration. The difference between a pump running near BEP and one running at a small fraction of BEP can be the difference between routine overhauls and repeated major repairs.
Is it better to repair or replace an old centrifugal pump?
A common rule of thumb is that replacement is warranted when repair cost approaches half to two-thirds of new equipment cost. Lifecycle analysis adds a second consideration: if a new pump would be meaningfully more efficient, either through modern hydraulic design or through better sizing for current conditions, the energy saving can justify replacement even when repair is inexpensive. Calculate the energy penalty of continuing with the old unit before deciding.
How do wear rings affect efficiency over time?
Wear rings maintain the pressure boundary between the discharge and suction sides of the impeller. As clearances open, pumped fluid recirculates internally instead of leaving through the discharge. Restoring clearance is among the most cost-effective maintenance actions available for recovering energy performance, which is why renewable rings should be specified rather than allowing the casing itself to become the wear surface.
What is the role of premium efficiency motors?
Premium efficiency motors reduce electrical losses by a few percentage points and run cooler, which extends insulation and grease life. For continuous duty the payback is usually short; for intermittent stormwater duty with few annual run hours, it may never be achieved. The calculation is the same one used for the pump: annual kWh difference times power cost, discounted over the evaluation period.
How does cavitation damage show up in the lifecycle numbers?
Twice over — as an energy penalty from the degraded impeller profile and as an accelerated replacement cycle. Both are traceable to suction conditions rather than to the pump, and the mechanisms are set out in detail under cavitation in centrifugal pumps, with the efficiency side of the equation covered under efficiency of centrifugal pump selection.
Conclusion
Key Takeaways: Lifecycle Cost Optimization
- Energy Dominates: Energy and maintenance together typically account for the large majority of lifecycle cost; purchase price is usually a modest fraction.
- Right-Sizing is Critical: Oversizing for safety pushes operation away from BEP, raising both energy use and maintenance frequency.
- State the Discount Rate: A nominal 20-year savings total is not a present value. The answer moves substantially with the discount and escalation rates, so publish both.
- Write the Evaluation Before Bidding: An LCC analysis prepared after bids open cannot override a low bid. Put the energy adder or efficiency threshold in the specification.
- Weight the Duty Cycle: Evaluate at the flows the station actually runs, not the peak design point.
- Monitor to Manage: Establish a wire-to-water baseline at commissioning and trend it to set maintenance intervals.
Optimizing Centrifugal Pumps Lifecycle Cost: CAPEX vs OPEX and Energy Payback requires an approach that extends past the purchase order. For municipal and industrial decision-makers, the objective is to procure performance and reliability over time rather than hardware on delivery.
When specifications prioritize total cost of ownership over lowest bid — and when the mechanism for doing so is embedded in the bid documents rather than argued afterward — the result is infrastructure that conserves budget, reduces energy consumption, and lightens the burden on maintenance staff. The cheapest pump to buy is rarely the cheapest pump to own.