Aeration Energy Optimization: Control Strategies That Reduce kWh Without Risk
INTRODUCTION
In municipal and industrial wastewater treatment, biological aeration typically accounts for 50% to 60% of total facility power consumption. As energy costs escalate and sustainability mandates become more stringent, engineers are consistently tasked with driving down operating expenditures. However, reducing blower output indiscriminately often leads to critical process failures, including ammonia permit violations, poor sludge settleability, or the proliferation of filamentous bacteria. Implementing true Aeration Energy Optimization: Control Strategies That Reduce kWh Without Risk is the definitive challenge for modern plant design and retrofits.
Most engineering oversights occur at the nexus of biological process demands, aeration equipment limitations, and automation logic. A highly efficient turbo blower is rendered ineffective if it is throttled by poorly tuned, hunting control valves, or if it is forced to operate against statically high header pressures. The transition from manual or simple constant-speed operation to dynamic, load-following aeration requires a precise orchestration of instrumentation, mechanical equipment, and control algorithms.
Aeration control technologies are deployed across suspended growth processes, including conventional activated sludge, Biological Nutrient Removal (BNR), Sequencing Batch Reactors (SBRs), and Moving Bed Biofilm Reactors (MBBRs). In these environments, the oxygen transfer efficiency and diurnal loading fluctuate wildly. When engineers specify improper control logic or fail to account for valve authority and blower turndown constraints, the result is excessive blow-off, system surging, accelerated mechanical wear, and wasted energy.
This technical article provides a comprehensive framework for designing, specifying, and implementing robust aeration control systems. By detailing Most-Open-Valve (MOV) pressure optimization, cascade Dissolved Oxygen (DO) control, and Ammonia-Based Aeration Control (ABAC), this guide will help consulting engineers, utility managers, and automation specialists achieve significant energy reductions while strictly maintaining effluent quality compliance.
HOW TO SELECT / SPECIFY
Specifying an optimized aeration control system requires a holistic approach that evaluates the biological process, the mechanical air delivery system, and the digital automation layer. The following criteria detail the engineering requirements for integrating Aeration Energy Optimization: Control Strategies That Reduce kWh Without Risk.
Duty Conditions & Operating Envelope
- Biological Loading Variations: Engineers must quantify the diurnal, seasonal, and wet-weather loading profiles. Systems must be designed to turn down during nocturnal low-load periods without causing blower surge or failing to meet minimum mixing constraints (typically 0.12 to 0.15 SCFM/sq ft of floor area).
- Airflow and Pressure Ranges: The control strategy must operate within the thermodynamic envelope of the blowers. System curves must be plotted against blower performance curves at both summer (highest specific volume, lowest mass flow) and winter (lowest specific volume, highest mass flow) conditions.
- Modes of Operation: Specifications should detail steady-state operations, transition logic during blower sequencing (starting/stopping parallel units), and fallback modes in the event of instrument failure (e.g., reverting to flow-paced or manual setpoints).
Materials & Compatibility
- Sensor Construction: DO probes and Ion-Selective Electrode (ISE) ammonia sensors operate in highly fouling mixed liquor. Specify luminescent/optical DO sensors with ruggedized, scratch-resistant sensing caps. ISE sensors should feature durable PVC or stainless steel housings with replaceable membrane cartridges.
- Airflow Control Valves (AFCVs): Valves situated on the aeration drops must withstand continuous modulating duty. Specify butterfly, iris, or V-port ball valves with 316SS discs/balls and EPDM or specialized resilient seats suitable for high-temperature (up to 250°F/120°C) compressed air.
- Actuator Durability: Modulating actuators must be rated for continuous duty (Class III or equivalent) to prevent overheating during constant micro-adjustments inherent to PID control loops.
Hydraulics & Process Performance
- Valve Authority: Proper valve sizing is critical. The AFCV must have sufficient pressure drop at the design flow to maintain control authority (typically aiming for a pressure drop of 10-15% of the total system pressure). Oversized valves will operate nearly closed, leading to non-linear response and system hunting.
- Diffuser Flux Dynamics: The control strategy must respect the minimum and maximum airflow rates per diffuser. Operating below the minimum flux (typically 0.5 SCFM/diffuser for fine bubble) allows mixed liquor ingress and fouling; operating above causes bubble coalescence and plummets mass transfer efficiency (Alpha factor).
- Process Constraints: For BNR plants, the logic must prevent over-aeration in aerobic zones to stop DO carryover into anoxic zones, which disrupts denitrification.
Installation Environment & Constructability
- Sensor Placement: DO and nutrient sensors must be installed in highly representative zones. Avoid areas near influent baffles, directly above diffusers (bubble interference), or in dead zones. A typical distance is 1/3 to 1/2 of the way down the aeration basin or at the effluent weir of the zone.
- Piping Geometry for Air Flowmeters: Accurate mass flowmeters (thermal dispersion or vortex shedding) require straight pipe runs—typically 10 to 15 pipe diameters upstream and 5 diameters downstream—to ensure laminar flow profiles.
- Actuator Accessibility: Valves and actuators are often elevated on drop pipes. Walkways or platforms should be designed for safe maintenance access, avoiding the need for scaffolding during routine calibration or actuator replacement.
Reliability, Redundancy & Failure Modes
- Sensor Redundancy: For critical ABAC or cascade DO loops, utilize multiple sensors per zone. Implement voting logic or a median-select algorithm in the PLC to discard outlier readings caused by ragging or sensor failure.
- Failsafe Positions: Actuators must be specified with explicit fail-safe behavior. On loss of signal or power, AFCVs should typically fail in their last position or fail open to ensure biological survival, though this depends on specific plant hydraulics.
- Blower Protection: The primary failure mode in dynamic control is driving centrifugal blowers into surge. Hardwired surge protection must operate independently of the primary process optimization PLC.
Controls & Automation Interfaces
This is the core of modern aeration efficiency. The automation architecture must seamlessly bridge process variables and mechanical execution.
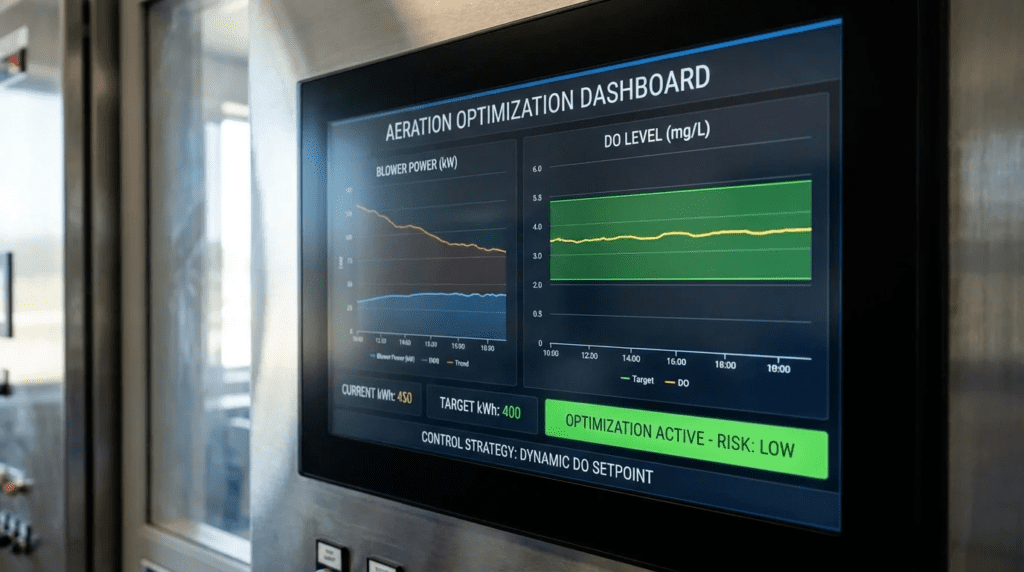
- Cascade DO Control: Instead of directly modulating a valve based on DO, the DO controller calculates an airflow setpoint based on the DO error. A secondary flow-control loop then modulates the valve to achieve that airflow. This decouples the fast-acting mechanical air dynamics from the slow biological oxygen uptake rate (OUR).
- Most Open Valve (MOV) / Pressure Minimization Logic: The control system monitors the position of all AFCVs. The logic automatically reduces the main air header pressure setpoint until the most open valve is between 85% and 95% open. This minimizes the discharge pressure requirement on the blowers, directly reducing kW consumption.
- Ammonia-Based Aeration Control (ABAC): Advanced control that dynamically adjusts the DO setpoints based on real-time ammonia concentrations. Feed-forward ABAC measures influent ammonia load; feedback ABAC measures effluent ammonia. This ensures power is only used when nutrient loads dictate it.
Maintainability, Safety & Access
- Auto-Cleaning Systems: Specify air-blast cleaning systems for in-situ sensors. Compressed air bursts (programmed every 2-6 hours) prevent biofilm accumulation, reducing manual wiping intervals from daily to monthly.
- Calibration Routines: Instrument specifications must mandate easy retrieval mechanisms (swing arms, guide rails) to pull sensors onto walkways for calibration without requiring full fall-protection gear.
- Lockout/Tagout: Electrical disconnects for actuators and isolation valves for flow meters must be clearly documented in the P&ID for safe O&M procedures.
Lifecycle Cost Drivers
- Baseline vs. Optimized kW: While capital expenditures (CAPEX) for advanced sensors, modulating valves, and PLC programming can range from $50K to $250K typical, the operational expenditure (OPEX) savings in blower energy often yield a Return on Investment (ROI) of 1.5 to 3 years.
- Sensor Consumables: When evaluating TCO, factor in the cost of DO sensor caps (replaced every 1-2 years) and ISE cartridges (replaced every 6-12 months).
AERATION ENERGY OPTIMIZATION: CONTROL STRATEGIES THAT REDUCE KWH WITHOUT RISK
To implement Aeration Energy Optimization: Control Strategies That Reduce kWh Without Risk, engineers must align the technology with the specific biological and mechanical realities of the facility. The tables below compare the prominent control strategies and their application fit.
COMPARISON TABLES
The following tables categorize different aeration control methodologies and provide a decision matrix to help engineers select the best-fit control architecture based on plant size and process complexity. Note that actual energy savings depend heavily on the baseline condition of the plant.
| Control Strategy | Core Mechanism | Energy Savings Potential* | Hardware/Instrumentation Required | Primary Limitations / Risks |
|---|---|---|---|---|
| Constant Pressure / Manual Valves | Blower maintains fixed header pressure. Operators manually adjust valves based on grab samples. | Baseline (0%) | Basic pressure transmitter, manual valves, constant speed or VFD blowers. | High over-aeration during low diurnal flows. Maximum energy waste. |
| Direct DO to Valve Control (Single Loop) | DO probe directly modulates the airflow valve to maintain a fixed DO setpoint. | 10% – 20% | DO Probes, Modulating AFCVs, fixed pressure setpoint. | Prone to hunting. Does not optimize blower discharge pressure. |
| Cascade DO with Airflow Control | DO controller dictates airflow requirement; secondary loop modulates valve to meet precise airflow. | 15% – 25% | DO probes, Thermal Mass Flowmeters, Modulating AFCVs. | Still operates at a fixed, artificially high header pressure, wasting blower kW. |
| Most Open Valve (MOV) / Pressure Reset | Continually lowers header pressure setpoint until one valve is nearly 100% open. | 25% – 40% | Valve position feedback, Master Aeration PLC, VFD Blowers. | Requires stable blower turndown. Surge risk if PID tuning is too aggressive. |
| Ammonia-Based Aeration Control (ABAC) | Dynamically adjusts DO setpoints (0.5 to 2.5 mg/L) based on real-time ammonia levels. | 35% – 50%+ | ISE Ammonia analyzers, full MOV integration, advanced algorithms. | High sensor maintenance burden. Requires skilled operators and regular calibration. |
*Approximate savings compared to a completely manual/constant-speed baseline.
| Facility Profile | Recommended Strategy | Key Driver / Constraint | Operator Skill Required | Relative Implementation Cost |
|---|---|---|---|---|
| Small Plant (< 1 MGD), Non-BNR | Cascade DO Control | Keep it simple. Limited maintenance bandwidth for advanced sensors. | Low to Moderate | $ (Low) |
| Medium Plant (1 – 10 MGD), Conventional AS | Cascade DO + MOV Logic | Energy savings from blower pressure reduction justify integration costs. | Moderate | $$ (Medium) |
| Large Plant (> 10 MGD), Tight TN/NH3 Limits | Full ABAC with MOV | Massive energy savings potential; strict nutrient compliance needed. | High (Instrument Tech needed) | $$$ (High) |
| Oxidation Ditches | DO/ORP Phased Control | Requires VFDs on surface aerators or rotor depth adjustment. | Moderate | $$ (Medium) |
| Industrial WWTP (High/Variable BOD) | Feed-Forward Load Control | Toxic shocks or massive BOD spikes require preemptive aeration. | High | $$$ (High) |
ENGINEER & OPERATOR FIELD NOTES
Designing an optimized aeration system on paper is only the first step. Translating that design into a robust, real-world operation requires meticulous attention during commissioning, an understanding of common specification failures, and a proactive O&M strategy.
Commissioning & Acceptance Testing
Proper functional testing is non-negotiable for advanced control strategies.
- FAT (Factory Acceptance Testing): Engineers must require a simulation of the PLC logic during the FAT. Inputs should be forced (e.g., simulate a DO drop, simulate a valve failure) to verify that cascade loops, MOV logic, and blower sequence algorithms respond appropriately without instability.
- SAT (Site Acceptance Testing): SAT must include loop tuning under actual process conditions. This involves step-testing the biological system: artificially lowering the DO setpoint, allowing the system to stabilize, and then raising it to observe PID response. Ensure the system is slightly overdamped to prevent valve hunting.
- Valve Stroking and Blower Interaction: Verify that actuator speeds align with blower ramp rates. If a valve closes faster than a centrifugal blower can spin down, the blower will hit the surge line. Actuator transit times (typically 30 to 120 seconds for full travel) must be coordinated with blower VFD acceleration/deceleration parameters.
Do not rely solely on theoretical surge curves. During SAT, purposefully throttle valves manually to push the blower toward its surge limit under controlled conditions. Document the actual surge line via current draw and vibration monitors, and set hard-stop protective boundaries in the master PLC at least 5-10% safely away from this line.
Common Specification Mistakes
- Specifying Linear Valves for Aeration Control: Butterfly valves have equal-percentage flow characteristics, meaning the bulk of the airflow change happens between 20% and 60% open. Specifying PID logic that expects a linear response from a butterfly valve causes severe hunting. Specifications must require signal characterization (a lookup table in the PLC) to linearize valve response.
- Ignoring Valve Authority: Designing the main air header too small or specifying oversized AFCVs results in valves operating near the 10-15% open position, where control is erratic. AFCVs should be sized so normal modulating occurs between 30% and 70% open.
- Lack of Deadbands: Failing to specify deadbands in the MOV logic. If the pressure reset logic attempts to keep a valve exactly at 90%, it will constantly hunt. Specify a target range (e.g., adjust pressure only if the most open valve is > 95% or < 85%).
O&M Burden & Strategy
To sustain energy efficiency, operators must maintain instrument accuracy.
- Probe Cleaning Schedules: Even with auto-cleaning, optical DO sensors require manual wiping with a soft cloth approximately every 2-4 weeks. ISE ammonia sensors generally require more frequent attention to prevent biofilm from altering diffusion rates.
- Calibration Drift: Optical DO caps degrade over time due to LED photobleaching. Follow manufacturer recommendations to update calibration coefficients or replace caps every 12-24 months. Operating with a probe that reads artificially low forces the blowers to over-aerate, destroying the intended energy savings.
- Predictive Maintenance: Monitor the position of the AFCVs over time. If a valve that historically operated at 50% open to maintain 2.0 mg/L DO is now operating at 80% to achieve the same result at similar loads, this indicates diffuser fouling. The control system is compensating for increased backpressure at the diffuser level.
Troubleshooting Guide
- Symptom: DO Levels Oscillating (Hunting): Root causes usually involve improper PID tuning (Gain too high), mismatched actuator/blower speeds, or oversized control valves. Fix: Decrease proportional gain, increase integral time, and ensure valve signal characterization is active.
- Symptom: Blower Frequently Surging or Blowing Off Air: Root cause is often DO setpoints being met, causing all valves to pinch down, pushing the blower up its curve to the surge limit. Fix: Implement or tune MOV logic to lower header pressure, allowing valves to open further. Ensure minimum airflow constraints are programmed to override DO loops if necessary.
- Symptom: Sluggish Response to DO Changes: Root cause may be biological (sudden toxic shock or high BOD slug) or mechanical (actuator failure, clogged air filters). Fix: Verify DO probe accuracy with a portable unit. Check flow meter readings to confirm air is actually reaching the basin.
DESIGN DETAILS / CALCULATIONS
Successful Aeration Energy Optimization: Control Strategies That Reduce kWh Without Risk requires rigorous mathematical modeling during the design phase. Engineering consultants must accurately translate biological oxygen requirements into pneumatic delivery targets.
Sizing Logic & Methodology
The core calculation for aeration optimization involves converting the Actual Oxygen Transfer Rate (AOTR) demanded by the biology into the Standard Oxygen Transfer Rate (SOTR) that equipment manufacturers use to rate their diffusers and blowers.
- Calculate AOTR: Determine the oxygen required for carbonaceous BOD removal (typically 1.1 to 1.5 lbs O2/lb BOD removed) and nitrification (typically 4.6 lbs O2/lb NH3 oxidized).
- Convert AOTR to SOTR: Use the standard ASCE equation:
SOTR = AOTR / [ (Alpha × F) × (Beta × C_sat_alt – C_do) / C_sat_20 × Theta^(T-20) ]
Where:- Alpha (α): Mass transfer efficiency ratio of wastewater to clean water (Highly variable, typically 0.4 to 0.7 depending on MLSS and diffuser fouling).
- Beta (β): Salinity/TDS correction factor (typically 0.95 to 0.98).
- C_do: Target Dissolved Oxygen concentration (e.g., 1.5 to 2.0 mg/L). Optimization strategy: By utilizing ABAC to lower C_do during low-load periods, the driving gradient (C_sat – C_do) increases, significantly reducing required SOTR and saving energy.
- F: Fouling factor.
- Determine Airflow (SCFM): Convert SOTR to airflow using the standard transfer efficiency (SOTE) of the specific diffuser grid at the designed submergence depth.
Engineers frequently use a static Alpha factor (e.g., 0.55) for all load conditions. In reality, Alpha fluctuates based on organic loading, surfactant concentrations, and airflow rates (diffuser flux). Advanced control systems dynamically adapt to changing Alpha factors by monitoring actual DO response vs. predicted OUR. Ensure your blower sizing accommodates the lowest likely Alpha (peak summer loading).
Specification Checklist
Ensure the following elements are explicitly detailed in the project specifications (typically Divisions 40 and 43):
- Master Control Panel (MCP): Must utilize a dedicated, high-speed PLC for aeration control, communicating with local unit control panels (UCPs) via industrial Ethernet (Modbus TCP/IP or Ethernet/IP).
- Valve Flow Characterization: Require the integrator to provide multi-point linearization curves in the PLC to convert flow requests into appropriate 4-20mA position signals based on valve geometry.
- Air Flowmeter Turndown: Specify mass flowmeters with a minimum turndown ratio of 10:1 to accurately measure airflow during severe nocturnal low-load periods.
- Performance Guarantees: If specifying proprietary control algorithms (like commercial ABAC platforms), require the vendor to guarantee specific energy reductions (e.g., “Max 1.2 kWh/kg BOD removed”) subject to defined baseline conditions.
Standards & Compliance
- WEF MOP 32: Refer to Water Environment Federation Manual of Practice No. 32 (Energy Conservation in Water and Wastewater Facilities) for baseline best practices in aeration efficiency.
- ASCE/EWRI 2-06: Ensure all oxygen transfer testing and diffuser efficiency references comply with the American Society of Civil Engineers standard for Measurement of Oxygen Transfer in Clean Water.
- ISA Standards: Follow International Society of Automation (ISA) standards for P&ID development, loop tuning, and HMI graphics layout to ensure operators have clear visibility into MOV and cascade loop status.
FAQ SECTION
What is Aeration Energy Optimization: Control Strategies That Reduce kWh Without Risk?
It refers to the integration of advanced process instrumentation, automated valves, and PLC algorithms—such as Most-Open-Valve (MOV) pressure reset and Ammonia-Based Aeration Control (ABAC)—to deliver exactly the amount of oxygen the biological process requires, at the lowest possible blower discharge pressure, without compromising effluent permit limits or mechanical equipment lifespan.
What is the difference between direct DO control and cascade DO control?
Direct DO control uses a single PID loop where the DO error directly drives the position of an air valve. This often causes hunting because airflow isn’t measured. Cascade control uses two loops: the primary DO loop calculates a required airflow rate, and a secondary, faster flow loop adjusts the valve to meet that exact airflow measured by a flowmeter. Cascade control is significantly more stable.
How does Most Open Valve (MOV) logic save blower energy?
Centrifugal blowers consume power relative to both the volume of air moved and the discharge pressure they must overcome. If valves are partially closed to control flow, the blower must produce artificially high pressure to push air through the restriction. MOV logic automatically drops the blower pressure setpoint until the most open valve is nearly 100% open, eliminating the artificial restriction and reducing blower kW by 10-30% typical.
What are the primary risks of turning blowers down too far?
Operating below a centrifugal blower’s minimum design flow can cause a phenomenon called “surge,” where airflow momentarily reverses, causing severe vibration and potential catastrophic mechanical failure to the impellers and bearings. Additionally, low airflow can cause mixed liquor to backflow into fine bubble diffusers, leading to permanent fouling.
How often do dissolved oxygen (DO) and ammonia sensors need maintenance?
Optical/luminescent DO sensors in aeration basins typically require a manual wipe-down every 2-4 weeks, assuming an air-blast auto-cleaning system is active. The luminescent caps require replacement every 1-2 years. Ammonia ISE sensors are more sensitive; they generally require calibration verification every 2-4 weeks and sensor cartridge replacements every 6-12 months.
How much does an advanced aeration control system upgrade cost?
Costs vary widely based on plant size and existing infrastructure. Adding DO cascade control and MOV logic to an existing plant with VFD blowers typically ranges from $50,000 to $150,000 for instruments, valves, and programming. Implementing full ABAC with ammonia analyzers across multiple trains can exceed $250,000. However, the energy savings usually provide an ROI of 1.5 to 3 years.
Why do control valves hunt, and how do you fix it?
Hunting occurs when a control loop overcorrects, causing a valve to constantly open and close without settling on a setpoint. In aeration systems, this is typically caused by overly aggressive PID tuning (proportional gain too high), oversized valves operating near the closed position, or a failure to characterize the non-linear flow curve of a butterfly valve within the PLC logic. Fixing it requires step-testing and re-tuning the loop.
CONCLUSION
- Decouple Variables: Utilize cascade control loops to separate slow biological oxygen uptake from fast mechanical airflow dynamics.
- Pressure is Power: Implement Most-Open-Valve (MOV) logic to continually drive down blower discharge pressure; forcing blowers to push air through partially closed valves wastes immense energy.
- Respect the Turndown Limit: Advanced control is useless if your blowers cannot turn down. Ensure blower surge limits and diffuser minimum flux constraints are hard-coded as process overrides.
- Linearize the Valves: Never use a direct PID output for a butterfly valve without characterizing the signal to account for its non-linear flow geometry.
- Maintain the Eyes of the System: The entire optimization ROI depends on accurate DO and nutrient data. Budget O&M labor for regular sensor cleaning and calibration.
Implementing Aeration Energy Optimization: Control Strategies That Reduce kWh Without Risk is not merely an exercise in purchasing premium equipment; it requires a systemic integration of biological process knowledge, fluid dynamics, and automation logic. Consulting engineers and plant decision-makers must view the aeration system as an interconnected triad: the blower package, the air distribution (valves/diffusers), and the intelligent control layer. Neglecting any one of these pillars will result in sub-optimal performance.
When selecting a control strategy, engineers should balance the theoretical energy savings against the facility’s O&M capabilities. While ABAC offers the highest reduction in kW consumption, it demands rigorous instrument maintenance that smaller facilities may not sustain. For many plants, transitioning from constant pressure operation to Cascade DO control paired with MOV logic represents the sweet spot—delivering 20% to 40% energy savings while remaining highly robust and operator-friendly.
Ultimately, successful optimization projects require rigorous factory and site acceptance testing. By deliberately pushing the system limits during SAT—forcing loop reactions and verifying surge protection—engineers can ensure that the automation safely handles diurnal extremes. When specified, tuned, and maintained correctly, these control strategies transform the aeration basin from an energy liability into a highly efficient, load-following asset.