
Aeration Maintenance Planning: Parts
Introduction
Aeration consumes more electricity than every other process in a wastewater treatment plant combined, typically 50 to 60 percent of total facility power, and it depends on equipment that degrades continuously and invisibly. A diffuser membrane does not fail on a date; it stiffens, fouls, and loses transfer efficiency over years while the blowers compensate by working harder. By the time low dissolved oxygen appears on a trend, the plant has usually been paying for the degradation for a long time. Aeration maintenance planning exists to convert that slow, invisible loss into a scheduled, budgeted, and predictable activity.
The planning problem has three parts that are usually treated separately and should not be. Parts availability determines whether a failure becomes a four-hour repair or a four-week outage. Intervals determine whether maintenance happens before performance degrades or after. And proactive asset management determines whether the utility is replacing components on evidence or on a calendar inherited from a manual nobody has read since commissioning.
This article sits within the broader field of wastewater aeration systems, which covers the technology itself. What follows assumes the system is installed and addresses the question of how to keep it delivering the oxygen transfer it was designed to deliver, at the energy cost it was designed to incur, for the life of the asset.
Subcategory Overview
Aeration operations and maintenance divides into several distinct problems, each with its own diagnostic approach and its own budget line. The subsections below outline the areas that make up this category.
Maintenance Planning: Parts, Intervals, and Proactive Asset Management
This hub covers the planning discipline itself: what to stock, when to intervene, and how to decide. It spans aeration maintenance intervals, the question of how often each component class actually needs attention as opposed to how often the manual says so, and aeration proactive asset management, the shift from calendar-based replacement to condition-based intervention using transfer efficiency, blower power per unit of oxygen delivered, and differential pressure as the governing evidence. The three are treated together here because they are one decision: an interval set without regard to parts lead time produces a plan that cannot be executed, and a proactive strategy without stocked parts produces a diagnosis nobody can act on.
Energy Optimization
Coverage of aeration energy optimization addresses the control side: dissolved oxygen setpoint management, most-open-valve control, ammonia-based aeration control, blower staging and turndown, and the control strategies that reduce kilowatt-hours without putting the biological process at risk. The relationship to maintenance is direct and frequently missed. A control strategy that appears to be saving energy may simply be responding to degraded diffusers by running at a higher pressure, and an optimization project implemented on a fouled grid will underdeliver against its business case.
Troubleshooting: Low DO, Foaming, and Process Instability
Coverage of aeration troubleshooting low DO, aeration foaming, and aeration process instability addresses the reactive side: what to do when the symptoms appear. These three are grouped because they share diagnostic territory. Low dissolved oxygen may be a blower problem, a diffuser problem, a control problem, or a loading problem, and distinguishing them requires the same instrumentation and the same baseline data that maintenance planning depends on. Foaming, likewise, may be biological, chemical, or a symptom of excessive aeration rather than insufficient aeration.
What Actually Wears in an Aeration System
A maintenance plan built on a generic equipment list will schedule the wrong things. The components that determine aeration performance degrade at very different rates and by different mechanisms.
Diffuser Membranes
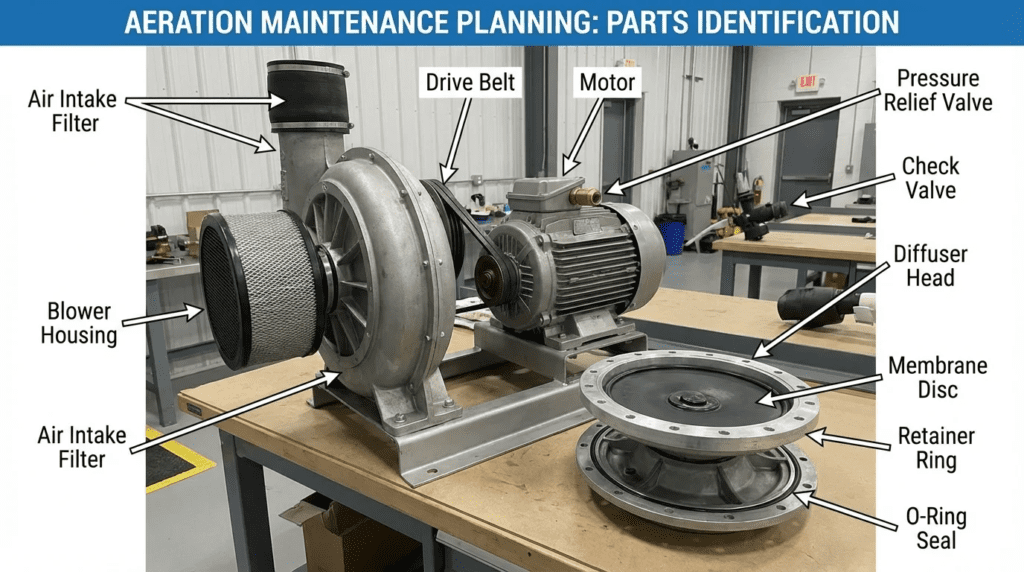
Membrane diffusers are the primary consumable in a fine bubble system and the component most responsible for gradual efficiency loss. Three mechanisms operate simultaneously. The elastomer stiffens with age and chemical exposure, requiring more pressure to open the perforations. Inorganic scale, principally calcium and iron, deposits on and within the perforations. And biological growth forms on the membrane surface where it contacts mixed liquor.
The result is a rising headloss across the diffuser, measured as dynamic wet pressure, and a falling oxygen transfer efficiency. Both are measurable, and the first is measurable continuously without draining anything. Typical membrane service life runs five to ten years depending on water chemistry, operating pattern, and whether the grid is ever operated in a way that allows moisture to enter the piping.
Blowers
Blower maintenance depends heavily on type. Positive displacement blowers require oil changes, belt tensioning or replacement, and periodic inspection of lobes and timing gears. Multistage centrifugal blowers need bearing lubrication and inlet filter attention but are otherwise robust. Single-stage high-speed turbo blowers, with magnetic or air bearings and variable frequency drives, shift the maintenance burden from mechanical wear to electronics, cooling, and filtration.
The common failure across all types is inlet filtration neglect. A restricted inlet filter raises energy consumption immediately and measurably, and it is the cheapest maintenance item in the entire aeration system to address.
Piping, Drop Legs, and Condensate
Air distribution piping is frequently omitted from maintenance plans entirely, which is why it causes so many unexplained performance problems. Moisture condenses in air piping as compressed air cools, and if drop legs and condensate drains are not maintained, water accumulates in low points, restricting flow to some diffuser grids and not others. The symptom is uneven aeration across a basin with no apparent cause, and the fix is to drain piping that nobody had on a schedule.
Stainless steel and PVC distribution piping also expands and contracts with air temperature, and expansion joints and supports need periodic inspection. A failed support puts bending stress on a manifold that was never designed to carry it.
Valves, Instruments, and Controls
Airflow control valves, whether butterfly or blade type, are exercised continuously in a modulating control scheme and wear accordingly. Dissolved oxygen probes drift and foul, and a drifted probe drives the control system in the wrong direction with complete confidence. Airflow meters require verification. Each of these is a small maintenance item whose failure produces a large and confusing process symptom.
Comparison Tables
| Component | Degradation Mechanism | Typical Interval | Condition Indicator | Access Requirement |
|---|---|---|---|---|
| Membrane diffusers | Elastomer stiffening, inorganic scaling, biofilm growth. | Cleaning 2-5 years; replacement 5-10 years. | Rising dynamic wet pressure; falling transfer efficiency. | Basin dewatering. The single largest access constraint in the system. |
| Ceramic diffusers | Pore plugging by inorganic deposits; mechanical breakage. | Cleaning 1-3 years; replacement 10-20 years. | Rising pressure; visible uneven bubble pattern. | Basin dewatering; acid cleaning in place where supported. |
| PD blowers | Bearing and gear wear; belt stretch; oil degradation. | Oil 2,000-4,000 hours; belts annually; overhaul 5-8 years. | Vibration signature; oil analysis; discharge temperature. | Accessible; blower room only. |
| Turbo blowers | Filter loading; VFD and control electronics; cooling system. | Filters 3-6 months; electronics per manufacturer. | Power per unit airflow; fault logs; inlet differential pressure. | Accessible; minimal mechanical intervention. |
| Air piping and drop legs | Condensate accumulation; support and expansion joint fatigue. | Condensate drainage quarterly; supports annually. | Uneven basin aeration; unexplained pressure differences between grids. | Accessible above water; dewatering for submerged sections. |
| Airflow control valves | Seat and bearing wear from continuous modulation. | Inspection annually; rebuild 5-10 years. | Position versus flow deviation; hunting. | Accessible. |
| DO probes | Membrane fouling; sensor drift; cap degradation. | Cleaning weekly to monthly; calibration monthly; cap 1-2 years. | Deviation from portable meter reference. | Accessible from walkway. |
| Strategy | Basis for Intervention | Best Fit | Limitations | Data Required |
|---|---|---|---|---|
| Reactive | Failure or permit excursion. | Non-critical, low-cost components with immediate spares. | Guarantees the energy penalty is paid in full before anyone acts. | None. |
| Calendar-based preventive | Elapsed time or run hours. | Blower servicing, filter changes, probe calibration. | Replaces serviceable components early and misses early failures. | Run hours, service log. |
| Condition-based | Measured performance against a commissioning baseline. | Diffusers, blowers, anything where degradation is gradual and measurable. | Requires baseline data that must be captured at commissioning. | Dynamic wet pressure, power per unit airflow, transfer efficiency. |
| Predictive | Trend extrapolation to a defined intervention threshold. | Large plants with historian data and analytical capability. | Requires sustained data quality and someone to look at it. | Multi-year trended process and energy data. |
Building the Plan
Start From the Baseline
Condition-based maintenance is impossible without knowing what the system looked like when it was new. The commissioning record should include clean water oxygen transfer test results, dynamic wet pressure across each diffuser grid at a stated airflow, blower power at defined operating points, and the airflow distribution between grids. If those numbers exist, every subsequent measurement has meaning. If they do not, the plant is comparing today against nothing and can only detect failures, not degradation.
Where a baseline was never captured, the next best option is to establish one now and accept that it represents a partially degraded system. Even a late baseline makes trending possible from that point forward, which is considerably better than continuing without one.
Set Intervals on Evidence, Not Habit
Manufacturer intervals are starting points derived from typical conditions. A plant with hard water and high iron will scale diffusers far faster than the manual assumes; one with soft water and a stable load may go substantially longer. The intervals worth writing into a plan are the ones the plant’s own data supports after two or three cycles of observation.
The exception is anything tied to a safety function or a warranty condition, where the specified interval governs regardless of what the data suggests.
Stock Against Lead Time, Not Against Probability
Spare parts decisions should be driven by consequence and lead time rather than by failure likelihood alone. A component that rarely fails but takes sixteen weeks to obtain and stops the process when it does belongs on the shelf. A component that fails regularly but is available locally the same day does not. Diffuser membranes in particular are worth examining carefully, because quantities are large, lead times can be long, and a partial replacement is often not useful, since mixing new and aged membranes on the same grid produces uneven air distribution.
Plan Around Basin Availability
The binding constraint on aeration maintenance is almost never the work itself; it is getting into the basin. Dewatering a train removes treatment capacity, requires the remaining trains to carry the full load, and in many plants can only be done in particular seasons. That reality should drive the whole plan: every task requiring dewatering should be batched into the same outage, the outage should be scheduled years in advance rather than triggered by a failure, and the parts for every batched task should be on site before the basin comes down.
Pro Tip: Trend Dynamic Wet Pressure Continuously. Pressure across a diffuser grid at a known airflow is the single most useful maintenance indicator in an aeration system, and it requires no basin entry, no special instrument, and no interruption to treatment. Log it monthly at a consistent airflow and plot it. A gradual rise is fouling, and its slope tells you when cleaning will be needed. A step change is a failure. Plants that trend this number schedule diffuser work years in advance; plants that do not discover the problem when the blowers can no longer keep up.
Design Decisions That Determine the Plan
Much of the maintenance burden is fixed before the plant is built. Whether the basin can be dewatered without taking the plant out of compliance, whether the diffuser grid can be lifted for service without draining, whether isolation valves exist per grid, and whether blower redundancy permits servicing one unit while maintaining full duty are all design outcomes. Engineers working on aeration sizing and design for a new facility or an upgrade are effectively writing the maintenance plan at the same time, and the maintainability questions deserve as much attention in that exercise as the peak load and turndown calculations do.
The technology choice carries the same weight. Fine bubble membrane grids deliver the best transfer efficiency and the largest maintenance obligation; coarse bubble systems are far more tolerant and far less efficient; mechanical surface aerators avoid basin entry entirely at the cost of efficiency and cold-weather performance. The trade-offs across aeration types are as much maintenance decisions as process ones, and a plant with limited staff and no dewatering capability may be better served by a less efficient technology it can actually maintain.
Supplier Factors
Parts availability is a supplier characteristic before it is a plant characteristic. Whether membranes for a given diffuser remain in production, whether the manufacturer supports a discontinued model, whether retrofit membranes from a third party will fit the existing holders, and how long a typical order takes all vary considerably. These questions belong in the evaluation of aeration equipment manufacturers at procurement, not at the point when a twenty-year-old grid needs replacing and the original supplier no longer makes the part. For a plant standardizing across multiple basins, a single supplier also reduces the spares inventory and the number of service relationships to maintain.
Engineer & Operator Field Notes
Common Planning Mistakes
- Scheduling diffuser work without confirming parts on site. A dewatered basin waiting on a delivery is the most expensive form of storage there is.
- Replacing membranes on one grid only. New and aged membranes on adjacent grids have different pressure characteristics, which redistributes air unevenly across the basin and can make overall performance worse.
- Calibrating DO probes against each other. Two drifted probes agreeing means nothing. Calibration requires an independent reference.
- Omitting air piping from the plan entirely. Condensate in low points is a common cause of uneven aeration that gets misdiagnosed as diffuser fouling, leading to an unnecessary basin outage.
- Treating the energy trend and the maintenance trend separately. Rising blower power at constant treatment load is a maintenance signal, and it arrives before any process symptom does.
Common Mistake: Letting the Blowers Hide the Problem. As diffusers foul and stiffen, the control system compensates automatically by increasing airflow and discharge pressure. Dissolved oxygen stays on setpoint, the process looks healthy, and nothing appears on an alarm list. The only visible symptom is a slow rise in energy consumption that is easily attributed to load growth or weather. Plants routinely operate for years in this state, paying a substantial and entirely avoidable energy penalty, because the parameter that would have revealed it was never being trended. Monitor power per unit of air delivered, not just dissolved oxygen.
The Cost of Deferral
Deferring aeration maintenance is unusually expensive compared with deferring most other plant maintenance, and the reason is that the penalty accrues continuously rather than arriving at failure. A pump left unrebuilt costs nothing until it fails. A fouled diffuser grid costs money every hour the blowers run.
The arithmetic is straightforward enough to run on a single page. Take the measured blower power draw, multiply by annual running hours and the electricity rate to get the current annual cost, then apply the power penalty implied by the elevated dynamic wet pressure. For a grid carrying one to two psi above its clean-water baseline, the penalty commonly lands somewhere in the range of ten to twenty percent of aeration energy, which at a mid-size plant is frequently a larger number than the membrane replacement itself. Both the penalty percentage and the electricity rate should come from facility data rather than from a rule of thumb before the figure goes into a budget request.
Two further costs sit outside the energy calculation and are routinely omitted. The first is the compression of options: a grid allowed to degrade until it fails forces an unplanned outage at whatever time of year it happens, rather than a planned one during low-flow season when the remaining basins can carry the load. The second is the risk to the blowers themselves, since sustained elevated backpressure loads bearings on positive displacement machines and pushes centrifugal machines toward surge. A deferral decision that considers only the membrane cost against the energy penalty understates the exposure.
The practical recommendation is to maintain the calculation as a live figure rather than producing it once during a budget cycle. A spreadsheet fed by the monthly DWP reading and the current electricity rate turns a maintenance request from an assertion into a number, which is generally what determines whether it survives the budget process.
What to Capture During an Outage
Basin outages are rare and expensive, so the inspection should extract more than the task requires. Photograph the diffuser grid before cleaning. Record dynamic wet pressure before and after. Note grit or sludge accumulation depth and distribution, which indicates whether mixing is adequate. Inspect membrane condition on a sample from several locations rather than one. Check holder and gasket condition, which frequently determines whether the next membrane change can be done quickly. Verify grid levelness, since a settled or bowed grid distributes air unevenly regardless of membrane condition.
Troubleshooting
- Blower power rising at constant load. Diffuser fouling, inlet filter restriction, or a control valve failing to open fully. Check the filter first because it is free.
- Uneven aeration across a basin. Condensate in a drop leg, a partially closed grid valve, or differential diffuser fouling. The pressure reading per grid distinguishes them.
- Dissolved oxygen on setpoint but effluent ammonia rising. Probe drift is the first thing to eliminate, before concluding that nitrification is failing.
- Persistent foaming. Distinguish biological foam from chemical and from over-aeration. All three exist, and the remedies are unrelated.
Design Details & Standards
Maintenance Plan Checklist
- Commissioning baseline captured: clean water transfer test, dynamic wet pressure by grid, blower power at defined points, airflow distribution.
- Component register listing every maintainable item with access requirement noted.
- Intervals stated per component, distinguishing manufacturer requirement from plant-derived interval.
- Condition indicators defined per component, with measurement method and frequency.
- Intervention thresholds stated, not just indicators, so a reading triggers a defined action.
- Spare parts list driven by lead time and consequence, with on-shelf quantities.
- Basin outage schedule projected several years forward, with all dewatering-dependent tasks batched.
- Parts-on-site confirmation required before any outage begins.
- Air piping condensate drainage on a named schedule.
- Instrument calibration schedule with independent reference method specified.
- Energy tracking as a maintenance indicator: power per unit airflow and per unit of oxygen delivered.
- Outage inspection protocol defining what is measured and photographed each time a basin is down.
- Supplier continuity check: confirmation that membranes and wear parts for installed equipment remain available.
- Ten-year replacement budget projection for diffusers and blower overhauls.
Applicable Standards and References
ASCE/EWRI 2-06 — Measurement of Oxygen Transfer in Clean Water. The basis for the commissioning baseline test and any subsequent re-testing.
ASCE 18-96 — Standard Guidelines for In-Process Oxygen Transfer Testing, for measuring transfer efficiency in mixed liquor rather than clean water.
WEF Manual of Practice No. 8 / ASCE MOP 76 — Design of Water Resource Recovery Facilities, covering aeration system sizing and the maintainability provisions that should accompany it.
WEF Manual of Practice No. 11 — Operation of Water Resource Recovery Facilities, the standard operational reference for aeration systems.
NFPA 820 — Fire Protection in Wastewater Treatment and Collection Facilities, governing electrical area classification in blower rooms and around basins.
Recommended Standards for Wastewater Facilities (Ten States Standards) — Referenced by many state regulators for aeration capacity, redundancy, and standby power requirements.
Frequently Asked Questions
How often should diffuser membranes be replaced?
Typical service life is five to ten years, but the interval that matters is the one the plant’s own data supports. Trend dynamic wet pressure across each grid at a consistent airflow. A steadily rising curve indicates fouling that cleaning may address; a curve that no longer responds to cleaning indicates the elastomer has stiffened past recovery and replacement is due. Water chemistry, particularly calcium and iron content, moves this interval substantially in both directions.
What is dynamic wet pressure and why does it matter?
It is the pressure required to push a given airflow through the diffuser grid while submerged. It rises as membranes stiffen, scale, and foul, and it is the earliest measurable indicator of diffuser degradation. Its practical value is that it can be measured without draining the basin, entering a confined space, or interrupting treatment, which makes it the one condition indicator a plant can realistically track continuously.
Can diffusers be cleaned in place?
Some systems support in-place acid cleaning, typically using formic or hydrochloric acid injected into the air stream to dissolve inorganic scale. It is effective against scaling and ineffective against elastomer stiffening or biological growth, which means it extends life rather than restoring it indefinitely. Whether the option exists depends on the diffuser and piping materials, and it should be confirmed with the manufacturer before being written into a plan.
Why does blower energy rise even when dissolved oxygen is on setpoint?
Because the control system is compensating for degradation. As diffusers foul, delivering the same oxygen requires more air at higher pressure, and an automatic control loop does that silently. Dissolved oxygen stays where it should be while energy consumption climbs. This is the reason energy tracking belongs in the maintenance plan rather than only in the utility budget review.
Should maintenance intervals follow the manufacturer’s recommendations?
As a starting point, yes, and as a permanent rule, no. Manufacturer intervals assume typical conditions and are necessarily conservative. After two or three cycles of observation, the plant’s own condition data should govern, with the exception of anything tied to a safety function or an active warranty requirement.
What should be stocked as aeration spares?
Stock against lead time and consequence rather than failure frequency. Long-lead items that stop the process when they fail belong on the shelf regardless of how rarely they fail. Short-lead items available locally generally do not, however often they fail. For diffusers specifically, consider whether a partial grid replacement is even useful, since mixing new and aged membranes produces uneven air distribution across the basin.
How do you plan maintenance when basins cannot be taken out of service?
This is the constraint that shapes everything. If dewatering a train would put the plant out of compliance, the options narrow to technologies that permit retrievable diffuser grids, temporary supplemental aeration during an outage, or scheduling work in the season of lowest loading. Where none of those is available, the honest conclusion is that the facility has a capacity problem rather than a maintenance problem, and the maintenance plan should say so explicitly so that it appears in the capital planning conversation.
Conclusion
Key Takeaways
- Capture the baseline or give up on condition-based maintenance — without commissioning data, degradation is invisible and only failures are detectable.
- Trend dynamic wet pressure monthly — it is the earliest diffuser indicator, requires no basin entry, and schedules work years ahead.
- Watch energy as a maintenance signal — rising power per unit of air at constant load is degradation that dissolved oxygen control will hide indefinitely.
- Basin availability drives the whole plan — batch every dewatering-dependent task into one scheduled outage with parts already on site.
- Stock against lead time, not failure rate — a rare failure with a sixteen-week part is the one that belongs on the shelf.
- Maintainability is designed in — retrievable grids, per-grid isolation, and blower redundancy are decisions made years before the first maintenance task.
- Never replace membranes on one grid alone — mismatched pressure characteristics redistribute air and can worsen overall performance.
Aeration maintenance planning is the discipline that keeps the largest energy consumer in a treatment plant from quietly becoming more expensive every year. The equipment does not announce its degradation; it simply costs more to achieve the same result, and the control system conceals that until the cost is substantial. A plan built on a commissioning baseline, a small set of well-chosen condition indicators, and an honest assessment of when basins can actually be taken down converts that invisible loss into a scheduled and budgeted activity.
The three components of the plan are one decision rather than three. Intervals determine what parts are needed and when; parts lead times determine which intervals are achievable; and the proactive strategy is what tells the plant whether either is set correctly. A facility that gets all three right generally finds that its aeration energy is lower, its outages are shorter, and its capital replacement is predictable enough to budget for rather than absorb as an emergency.