Submersible Lifecycle Cost: CAPEX vs OPEX and Energy Payback
Introduction
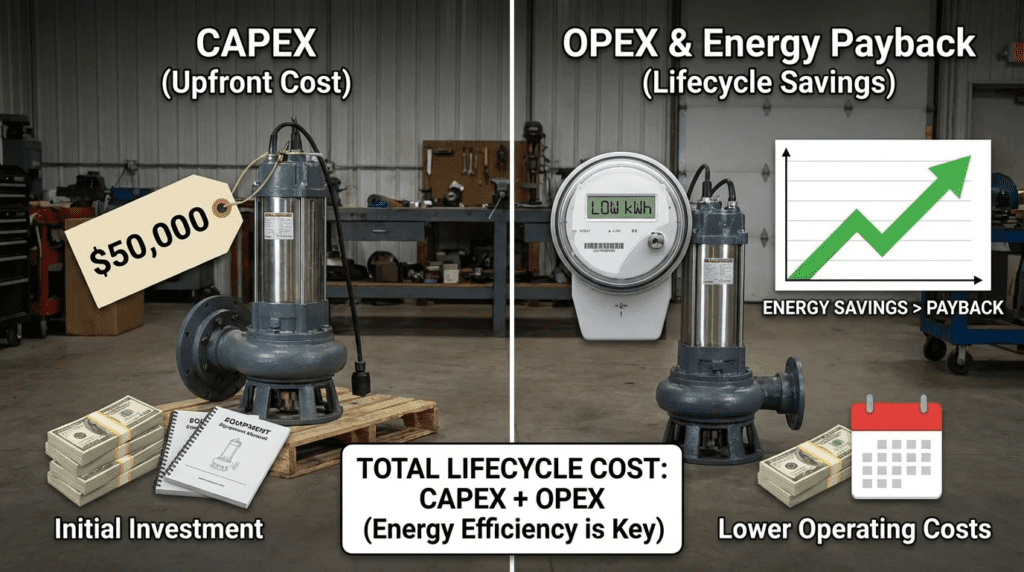
In municipal and industrial wastewater handling, the “iceberg effect” is a well-documented economic reality: the purchase price of a pump represents only a fraction of its true cost. Yet, municipal bid structures often prioritize the lowest initial capital expenditure (CAPEX), inadvertently locking utilities into decades of excessive operational expenditure (OPEX). For consulting engineers and plant directors, the challenge lies in quantifying Submersible Lifecycle Cost: CAPEX vs OPEX and Energy Payback to justify the selection of higher-efficiency, higher-reliability equipment.
Submersible pumping systems—ubiquitous in lift stations, influent works, and sludge handling—are notoriously energy-intensive. Industry data suggests that over a typical 20-year asset life, energy consumption can account for 65% to 85% of the total cost of ownership (TCO), while maintenance accounts for another 10-15%. The initial purchase price (CAPEX) frequently represents less than 10% of the lifecycle total. Consequently, a “low bid” pump that is 5% less efficient or prone to ragging can erase its initial savings within the first 18 months of operation.
This article provides a rigorous engineering framework for evaluating Submersible Lifecycle Cost: CAPEX vs OPEX and Energy Payback. It moves beyond generalities to examine the specific engineering variables—hydraulic efficiency, motor classification, ragging frequency, and repair intervals—that drive the financial model. By understanding the interplay between system curves, wire-to-water efficiency, and maintenance labor, engineers can design specifications that deliver long-term value rather than short-term compliance.
How to Select / Specify
Selecting a submersible pump requires balancing conflicting constraints: passing solids versus hydraulic efficiency, and minimizing motor heat versus compact installation. A thorough analysis of Submersible Lifecycle Cost: CAPEX vs OPEX and Energy Payback begins with accurate specification of the duty cycle and operating environment.
Duty Conditions & Operating Envelope
The foundation of lifecycle efficiency is the match between the pump curve and the system curve. Oversizing pumps “just in case” forces operation to the left of the Best Efficiency Point (BEP), resulting in recirculation cavitation, shaft deflection, and premature bearing failure.
- Flow and Head Variability: Analyze not just the peak design flow, but the daily average. A pump selected for a peak event (100-year storm) may operate at 30% capacity for 95% of its life. Variable Frequency Drives (VFDs) are critical here, but they introduce their own efficiency losses (typically 2-3%) which must be factored into the payback calculation.
- Intermittent vs. Continuous Duty: For stormwater (intermittent), CAPEX dominates the equation; cheaper, less efficient pumps are often justifiable. For influent pumping (continuous), energy efficiency dominates, justifying premium hydraulic designs.
- Net Positive Suction Head (NPSHa): In submersible applications, submergence depth dictates NPSHa. Ignoring this leads to cavitation damage, drastically increasing maintenance costs (OPEX) and reducing asset life.
Materials & Compatibility
Material selection impacts the “Maintenance” variable in the LCC equation. While standard cast iron (ASTM A48 Class 30) is sufficient for domestic sewage, it fails rapidly in septic or industrial environments.

- Abrasion Resistance: In grit-heavy applications (e.g., influent lift stations with combined sewers), high-chrome iron impellers or hardened wear rings extend the hydraulic efficiency lifespan. As wear rings erode, recirculation increases, and efficiency drops—a hidden energy cost over time.
- Corrosion: For industrial wastewater or high H2S environments, CD4MCu (duplex stainless steel) or 316SS prevents impeller degradation. While increasing CAPEX by 30-50%, these materials often double the mean time between repairs (MTBR).
- Cooling Jackets: In dry-pit submersible applications or where un-submerged operation is frequent, integral cooling jackets are mandatory to prevent stator insulation degradation (Arrhenius equation: every 10°C rise halves insulation life).
Hydraulics & Process Performance
The trade-off between solids handling and efficiency is the central engineering challenge.
- Enclosed Channel Impellers: Highest efficiency (75-85%), but susceptible to clogging. Best for screened effluent or stormwater.
- Vortex Impellers: Lowest efficiency (40-55%), but excellent solids handling. The high energy penalty makes them poor candidates for continuous duty unless ragging is severe.
- Chopper/Grinder Pumps: These utilize energy to macerate solids. While they consume more power per gallon pumped, they eliminate the OPEX cost of “de-ragging” trips by operators.
Installation Environment & Constructability
Civil costs (excavation, concrete) often dwarf equipment costs. Specifying submersibles that fit existing guide rail systems or utilize auto-coupling systems compatible with multiple vendors can reduce installation CAPEX. However, poor wet well design (e.g., lack of benching) leads to solids accumulation, requiring vacuum truck call-outs—a significant OPEX driver.
Reliability, Redundancy & Failure Modes
Reliability directly influences the “Downtime Cost” variable in LCC analysis.
- Bearing Life: Specify L10 bearing life of 50,000 or 100,000 hours. Standard commercial pumps may offer only 20,000 hours.
- Seal Redundancy: Dual mechanical seals with an intermediate oil chamber are standard. Moisture detection probes in both the oil chamber and the stator housing allow for predictive maintenance before catastrophic failure.
- Cable Entry: The cable entry point is the most common leak path. Specify separated terminal boards or epoxy-potted cable entries to prevent capillary action wicking water into the motor.
Lifecycle Cost Drivers
To accurately calculate Submersible Lifecycle Cost: CAPEX vs OPEX and Energy Payback, engineers must evaluate:
- Energy Consumption (Ce): Function of flow, head, specific gravity, wire-to-water efficiency, and operating hours.
- Maintenance Cost (Cm): Labor and parts for routine PM, plus unscheduled repairs (clogs, seal failures).
- Downtime Cost (Cd): Cost of bypass pumping or regulatory fines during failure.
- Decommissioning/Disposal (Cs): Residual value or cost to scrap.
When calculating LCC, standard energy formulas assume constant efficiency. In reality, rag buildup on the leading edge of an impeller can reduce efficiency by 10-20% weeks before a full clog stops the pump. If a pump requires weekly de-ragging, the “average” efficiency is significantly lower than the factory curve. Self-cleaning hydraulic designs maintain their efficiency curve longer, offering a hidden energy payback.
Comparison Tables
The following tables provide a framework for comparing submersible pump technologies and their impact on CAPEX and OPEX. These tables are designed to assist in the initial selection phase before detailed calculations are performed.
| Impeller Technology | Typical Efficiency (BEP) | Solids Handling Capability | CAPEX Relative Cost | OPEX: Energy Profile | OPEX: Maintenance Profile |
|---|---|---|---|---|---|
| Enclosed Channel | 75% – 86% | Fair (Requires wear rings) | Medium | Lowest (Best payback for clean water) | Moderate (Risk of clogging; wear ring adjustment needed) |
| Semi-Open (Non-Clog) | 70% – 80% | Good (Back-swept vanes) | Medium | Low-Medium | Low (Often includes cutting grooves or relief) |
| Vortex (Recessed) | 40% – 55% | Excellent (Passes stringy solids) | Low | Highest (Poor energy payback) | Lowest (Minimal wear, very low clog risk) |
| Chopper / Grinder | 50% – 70% | Superior (Actively destroys solids) | High | High (Energy used for cutting) | Low (Eliminates de-ragging labor; cutter replacement required periodically) |
| Screw Centrifugal | 70% – 80% | Very Good (Gentle handling) | Very High | Low | Medium (Complex geometry for repairs) |
| Application Scenario | Primary Constraint | Recommended Tech | Lifecycle Cost Priority | Energy Payback Potential |
|---|---|---|---|---|
| Raw Sewage Lift Station (Large >20 MGD) | Energy Consumption | Enclosed Channel or Mixed Flow | OPEX (Energy) dominates. 1% efficiency gain saves $10k+/yr. | Very High |
| Neighborhood Lift Station (<0.5 MGD) | Clogging / Ragging | Chopper or Vortex | OPEX (Labor) dominates. Avoid truck rolls. | Low (Reliability is the payback) |
| Stormwater / Flood Control | Reliability / Capacity | Axial / Mixed Flow | CAPEX dominates due to low annual run hours. | Negligible |
| RAS/WAS Pumping | Flow Control / Consistency | Semi-Open or Screw Centrifugal | Balanced. VFD rangeability is key. | Moderate |
| Digester Sludge | Viscosity / Ragging | Chopper or Screw Centrifugal | Maintenance reliability. | Low |
Engineer & Operator Field Notes
Real-world performance often deviates from the factory test stand. The following field notes address the practical aspects of managing Submersible Lifecycle Cost: CAPEX vs OPEX and Energy Payback.
Commissioning & Acceptance Testing
A rigorous acceptance test is the first defense against premature failure.
- Wire-to-Water Verification: Do not rely solely on the factory pump curve. Perform a draw-down test in the wet well to calculate actual flow while measuring simultaneous power consumption (kW). This establishes the “Day 1” baseline for efficiency tracking.
- Vibration Baseline: Record vibration signatures (velocity in in/s or mm/s) at the top of the guide rail bracket or, if dry-pit, directly on the bearing housing. This baseline is essential for predictive maintenance trending.
- Voltage Drop Check: Submersible cables can be long. Verify voltage at the motor terminals (if accessible) or calculate drop based on cable length and gauge. Undervoltage increases amp draw and heat, shortening motor life.
Common Specification Mistakes
- “Or Equal” Loopholes: Using vague “or equal” language allows contractors to supply pumps with smaller service factors (1.0 vs 1.15) or lower insulation classes (Class F vs Class H), which meet the hydraulic duty point but fail sooner.
- Oversizing for Future Growth: Specifying a pump for year-20 flows results in year-1 operation at 10-20% of BEP. This causes excessive recirculation, vibration, and energy waste. Solution: Specify VFDs or smaller impellers for initial years, with a plan to upgrade impellers later.
- Ignoring Cable Quality: Standard cables can wick water if the jacket is damaged. Specifying heavy-duty, submersible-rated mining cable (e.g., Type G-GC or SOOW with specific jacket compounds) reduces cable failure risks.
O&M Burden & Strategy
Operational strategies significantly influence the OPEX component.
- Amperage Trending: A gradual increase in amperage for the same flow rate indicates wear ring degradation or potential binding. A sudden drop in amperage often indicates a clogged intake or air binding.
- Cleaning Cycles: If operators must deploy a vacuum truck weekly to clean the wet well, the station design (not just the pump) is likely at fault. Fillets and benching improvements can reduce this recurring cost.
- Impeller Clearance Adjustment: For semi-open impellers, regular clearance adjustment (annually) restores efficiency and pressure. Neglecting this maintenance results in a permanent 5-15% energy penalty.
Engineers often confuse Soft Starters with VFDs regarding energy savings. Soft Starters reduce inrush current and mechanical stress (good for CAPEX/life), but they do not save energy during operation. Only VFDs save energy by allowing the pump to run at reduced speeds matching lower flow requirements.
Design Details / Calculations
To rigorously justify a higher CAPEX for better OPEX, engineers must perform a Net Present Value (NPV) calculation. This section outlines the methodology for quantifying Submersible Lifecycle Cost: CAPEX vs OPEX and Energy Payback.
Sizing Logic & Methodology
- Define the System Curve: Calculate static head and friction losses (Hazen-Williams or Darcy-Weisbach) across the full range of flow.
- Overlay Pump Curves: Select pumps where the BEP aligns with the most frequent operating point, not necessarily the peak flow point.
- Check Motor Loading: Ensure the motor is not overloaded at the “run-out” point (far right of the curve), which may occur during single-pump operation in a duplex station (if friction losses are low).
LCC Calculation Formula
The Hydraulic Institute (HI) Standard for Lifecycle Cost defines the LCC as:
LCC = Cic + Cin + Ce + Co + Cm + Cs + Cenv + Cd
- Cic: Initial cost, purchase price (pump, system, pipe, aux services).
- Cin: Installation and commissioning cost.
- Ce: Energy costs (The largest variable).
Calculation: $Ce = sum [ (Q times H times SG) / (3960 times eta_{ww}) ] times 0.746 times text{Hours} times text{Rate}$ - Co: Operation costs (labor supervision).
- Cm: Maintenance and repair costs (parts + labor).
- Cs: Downtime costs (loss of production or fines).
- Cenv: Environmental costs (disposal of waste).
- Cd: Decommissioning/disposal cost.
Energy Payback Analysis Example
Consider two 50 HP pumps for a lift station running 2,000 hours/year at $0.12/kWh.
- Pump A (Low Bid): Cost $15,000. Wire-to-water efficiency 60%.
- Pump B (Premium): Cost $22,000. Wire-to-water efficiency 68%.
Energy Calculation:
- Pump A annual energy: ~62,166 kWh = $7,460/year.
- Pump B annual energy: ~54,852 kWh = $6,582/year.
- Savings: $878/year.
- Simple Payback: ($7,000 Premium) / ($878 Savings) = 7.9 years.
Note: This simple payback improves drastically if Pump B also reduces clogging interventions. If Pump B prevents just 4 operator call-outs per year (valued at $500 each), the savings increase to $2,878/year, reducing payback to 2.4 years.
Standards & Compliance
- HI 11.6: Rotodynamic Submersible Pumps for Hydraulic Performance, Hydrostatic Pressure, Mechanical, and Electrical Acceptance Tests.
- NEMA MG-1: Defines motor insulation classes and efficiency standards (Premium Efficiency / IE3).
- AWWA E102: Submersible Vertical Turbine Pumps (relevant for deep well applications).
FAQ Section
What is the typical lifespan of a submersible wastewater pump?
A high-quality municipal submersible pump typically lasts 15 to 20 years. However, the wet-end components (impeller, wear rings, mechanical seals) usually require refurbishment or replacement every 5 to 7 years, depending on the severity of the fluid (abrasion/corrosion). Motors often outlast the hydraulic ends if moisture is kept out and cooling is adequate. In industrial applications with aggressive chemistry or high solids, lifespans may be significantly shorter.
How does a VFD affect the Submersible Lifecycle Cost?
A Variable Frequency Drive (VFD) generally lowers Lifecycle Cost (LCC) by reducing energy consumption (Ce) and mechanical stress. By allowing the pump to match the influent flow rate, the VFD prevents the pump from cycling on/off frequently, which extends motor and contactor life. It also allows the pump to run at lower speeds where friction losses are lower, significantly improving energy efficiency (Affinity Laws). However, VFDs add initial CAPEX and require climate-controlled panels.
What is “wire-to-water” efficiency and why does it matter?
Wire-to-water efficiency is the combined efficiency of the entire pumping system, calculated as: Pump Hydraulic Efficiency × Motor Efficiency × Drive Efficiency. It represents the true energy conversion from the electrical grid to fluid movement. Manufacturers often market just the hydraulic efficiency or just the motor efficiency, which can be misleading. When calculating energy payback, always use the wire-to-water efficiency at the specific duty point.
When should I specify a chopper pump over a standard non-clog pump?
Select a chopper pump when the operational cost of clogging (manual de-ragging labor, vacuum trucks, safety risks) exceeds the cost of the additional energy the chopper pump consumes. Standard non-clog pumps are more hydraulically efficient but fail if the solids load is high (wipes, rags). If a station requires de-ragging more than twice a month, the OPEX savings from a chopper pump usually justify the higher energy consumption and initial CAPEX.
How do I calculate the payback period for a premium efficiency motor?
To calculate payback, determine the difference in initial cost between the standard and premium unit. Then, calculate the annual energy savings: $Savings = (kW_{standard} – kW_{premium}) times text{Hours/Year} times text{Cost/kWh}$. Divide the cost difference by the annual savings to get the payback in years. For continuous duty applications (24/7 operation), payback is often less than 2 years. For intermittent stormwater pumps, payback may never be achieved.
Does installing a submersible pump on a VFD require a special motor?
Yes. Submersible motors running on VFDs should be “Inverter Duty” rated per NEMA MG-1 Part 31. This ensures the insulation system can withstand voltage spikes (dV/dt) caused by the VFD. Additionally, if the pump runs at reduced speeds, cooling can be an issue. Engineers must verify that the flow velocity across the motor housing is sufficient for cooling at minimum speed, or specify a cooling jacket.
Conclusion
KEY TAKEAWAYS
- The 10/90 Rule: Purchase price (CAPEX) is typically less than 10-15% of the total 20-year lifecycle cost. Energy and maintenance comprise the vast majority.
- System Curve Alignment: Energy payback is maximized when the pump is selected to operate at its BEP for the weighted average of its duty cycle, not just the peak design flow.
- Solids vs. Efficiency: High hydraulic efficiency is worthless if the pump clogs. Include estimated “de-ragging” labor costs in your OPEX models.
- Material Selection: Hardened materials (High Chrome, CD4MCu) increase CAPEX but significantly extend the mean time between repairs (MTBR) in abrasive environments.
- Testing: Always require wire-to-water efficiency verification during commissioning to establish a baseline for future performance tracking.
Optimizing Submersible Lifecycle Cost: CAPEX vs OPEX and Energy Payback is an exercise in long-term thinking. While the pressure to reduce upfront construction costs is intense, the engineer’s responsibility is to design systems that are affordable to operate and maintain over decades. By leveraging detailed LCC models, correctly applying VFD technology, and selecting hydraulic designs that balance efficiency with reliability, utilities can avoid the “low bid” trap.
Ultimately, the most expensive pump is not the one with the highest price tag—it is the one that clogs weekly, consumes excessive power, and requires early replacement. A robust specification that prioritizes Total Cost of Ownership ensures that public funds are spent efficiently, delivering reliable service for the life of the infrastructure.