
Aeration Tanks: Key Benefits and Functions Explained
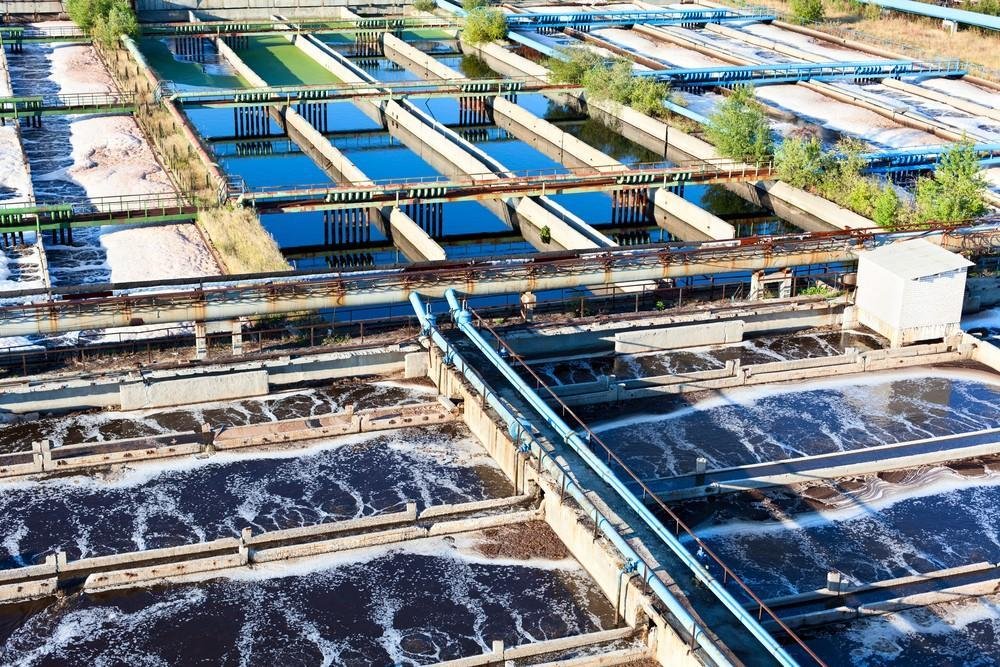
Aeration Tanks in Wastewater Treatment: Design, Function, and Engineering
Aeration tanks play a crucial role in wastewater treatment by introducing air into water to encourage microbial growth. These microorganisms consume organic material, helping to purify and clean wastewater. Aeration tanks are a core component of activated sludge systems used in many treatment plants today.
Air is introduced into aeration tanks primarily through blowers or mixers, each using different techniques to enhance treatment efficiency. The careful design and engineering of these systems directly influence treatment performance.
The design and operation of aeration tanks have a significant impact on efficiency and environmental footprint.
Understanding their role enables more sustainable wastewater management practices.
Key Takeaways
- Aeration tanks are essential for effective wastewater purification.
- Air is introduced using blowers or mechanical mixers.
- System design directly affects efficiency and sustainability.
Overview of Aeration Tanks
Aeration tanks support microbial communities that break down organic matter. By supplying oxygen, these tanks form the backbone of biological wastewater treatment systems and often operate alongside aeration basins used in wastewater treatment plants.
Definition and Purpose
Aeration tanks are a central component of the aeration tank wastewater treatment process, where oxygen is introduced to support aerobic microorganisms. They introduce oxygen into wastewater, enabling aerobic microorganisms to metabolize organic pollutants.
These microbes form flocs that settle easily in subsequent treatment stages, significantly reducing pollutant concentrations. Without sufficient oxygen, microbial activity slows, leading to incomplete treatment.
Historical Development
The activated sludge process emerged in the early 20th century in England, revolutionizing wastewater treatment by introducing biological methods for pollution control.
Over time, advancements in blower technology, diffusers, and control systems improved aeration efficiency and reduced operational costs. These developments highlight the role of innovation in environmental engineering.
Types of Aeration Tanks
Aeration tanks are available in several configurations, each suited to specific treatment needs.
- Continuous-flow tanks: Maintain a steady inflow for consistent treatment
- Sequential batch reactors (SBRs): Treat wastewater in batches, offering operational flexibility
Tanks also differ in aeration methods. Some use diffusers that release air bubbles, while others employ mechanical mixers to distribute oxygen evenly. Tank type selection directly affects treatment efficiency.
Design and Engineering
Aeration tank design influences oxygen transfer, mixing, and overall treatment effectiveness. Key engineering considerations include configuration, materials, aeration method, and oxygen efficiency.
Tank Configurations
Aeration tanks may be rectangular or circular. Rectangular tanks offer efficient space usage and integration with other treatment units, while circular tanks promote turbulent mixing.
Tank dimensions affect oxygen transfer rates and mixing patterns. Proper flow dynamics ensure adequate contact between air and wastewater.
Material Considerations
Material selection affects durability and long-term performance.
- Reinforced concrete: Durable and corrosion-resistant
- Steel: Strong and versatile but requires corrosion protection
Designers must also consider wastewater chemistry, including pH and corrosive compounds, to ensure longevity.
Aeration Methods
Two primary aeration methods are used:
- Blowers: Supply air through bottom diffusers, producing fine bubbles
- Mixers: Mechanically agitate water to distribute oxygen
Method selection depends on energy efficiency, maintenance needs, and wastewater characteristics.
Oxygen Transfer Efficiency
Oxygen transfer efficiency (OTE) measures how effectively supplied air dissolves into wastewater. High OTE supports robust microbial activity and lowers energy costs.
Optimizing diffuser design, bubble size, and aeration rates improves oxygen transfer efficiency, making it a critical factor in sustainable treatment system design.
Aeration / Energy Estimation Calculator
Planning-level estimation of blower power and energy use based on basin volume and oxygen demand.
Total Oxygen Required: lb/day
Estimated Blower Power: hp
Estimated Electrical Load: kW
Daily Energy Use: kWh/day
Annual Energy Use: kWh/year
Power per Blower: hp
Planning-level estimate only. Actual power depends on diffuser type, alpha factor, depth, fouling, and control strategy.
Operational Parameters
Operational parameters determine how effectively aeration tanks support microbial treatment. Key factors include flow rates, process control, and maintenance practices.
Flow Rates and Loading
Flow rates dictate how much wastewater enters the aeration tank and the time available for treatment. Excessive flow can overload the system, reducing treatment efficiency.
Loading rates reflect the concentration of organic matter entering the tank. Balancing flow and loading rates ensures optimal microbial activity and effective wastewater treatment.
Process Control
Process control involves monitoring dissolved oxygen, pH, and temperature to maintain ideal conditions for microbial health.
- Dissolved Oxygen (DO): Must remain within optimal ranges
- pH Levels: Affect microbial metabolism
- Temperature: Influences reaction rates and treatment stability
Precise control prevents energy waste and ensures consistent treatment performance.
Maintenance and Upkeep
Routine maintenance preserves aeration efficiency and system reliability.
- Inspecting blowers and mixers for wear
- Cleaning tanks to prevent buildup
- Checking seals and mechanical components
Proper upkeep minimizes downtime and extends equipment lifespan.
Applications in Wastewater Treatment
Municipal Wastewater Treatment
Aeration tanks are central to municipal wastewater treatment, enabling large-scale biological processing. In the U.S., they support treatment of over 34 billion gallons of wastewater daily.
They are the core of the activated sludge process, requiring efficient design to manage energy use while meeting regulatory standards.
Industrial Wastewater Management
Industrial wastewater often contains chemicals and heavy metals that require intensive treatment. Aeration tanks reduce pollutant loads before discharge.
Energy efficiency is critical due to high power consumpt
Subcategory Overview: Aeration Tank Sub-Topics and Decisions
Aeration basins and tanks are central to secondary biological treatment, but their selection, operation, and lifecycle management raise distinct sub-topics that engineers and operators encounter routinely. The H3 sections below cover the specific resources that address aeration tank optimization, the case for upgrading older basins, and the recurring retrofit-versus-replace decision that defines aeration capital planning at most utilities.
Aeration Tank Wastewater Treatment Operations
The operational deep-dive on aeration tank wastewater treatment focuses on optimizing oxygen delivery for efficient pollutant removal — the core performance metric of any activated sludge process. Operators tracking aeration performance work with three primary indicators: dissolved oxygen profile across the basin (target typically 1.5–2.5 mg/L in aerobic zones, less than 0.5 mg/L in anoxic zones), specific oxygen uptake rate (SOUR, mg O₂ per g VSS per hour), and aeration energy per pound of BOD removed (kWh/lb BOD). Plants meeting modern energy benchmarks deliver oxygen at 0.4–0.8 kWh/lb BOD removed; older plants without DO control or with deteriorated diffusers commonly run at 1.5–2.5 kWh/lb BOD — a difference that can represent hundreds of thousands of dollars per year in unnecessary energy cost at mid-sized plants.
10 Surprising Benefits of Upgrading Your Aeration Tank System
The case for aeration upgrades extends well beyond energy savings. The detailed analysis of 10 surprising benefits of upgrading your aeration tank system identifies value streams that often justify the capital expense even before the energy savings calculation: improved nitrification reliability (better DO control supports more stable ammonia oxidation), reduced biosolids production (better F/M control reduces sludge yield), lower polymer cost in dewatering (more stabilized biomass), and improved permit compliance margin. Many of these benefits compound — a plant that upgrades aeration to support nitrification often unlocks effluent total nitrogen credits, which can defer or eliminate the need for separate denitrification capital. Other benefits include odor reduction (well-aerated basins emit less hydrogen sulfide), foam control (better mixing breaks up filamentous organisms), and operator workload reduction (modern controls require fewer manual interventions).
Retrofit vs Replace: The Aeration Upgrade Decision
Most aeration system upgrades present a fundamental capital decision: retrofit vs replace existing aeration in aging basins. Retrofit options keep the existing basin shell and replace internals — diffusers, blowers, controls — at 30–50% of full replacement cost and with 6–12 month installation timelines. Replacement involves new tankage, new structural and hydraulic infrastructure, and 24–36 month construction timelines, but eliminates the constraints of working within an existing geometry. The decision typically turns on basin condition (concrete deterioration, leaks), hydraulic limitations (insufficient depth or volume for nitrification), permit changes (new effluent limits requiring more capacity), and capital availability. Most utilities perform two or three retrofit cycles before facing replacement; understanding when retrofit value is exhausted is one of the highest-stakes decisions in plant capital planning.
Selection & Specification Framework
Selecting and specifying aeration tank configurations balances treatment performance, energy efficiency, capital cost, and operator workload. The decision logic depends heavily on plant size, effluent goals, and the lifecycle stage of the existing infrastructure.
Decision Hierarchy for Aeration Tank Specification
- Establish treatment goals: BOD removal only, or BOD plus nitrification, or full BNR (biological nutrient removal). Each goal sets minimum HRT, SRT, and DO control requirements.
- Determine basin volume and HRT: Conventional activated sludge HRT 4–8 hours; extended aeration 18–36 hours; nitrification typically requires 6–10 hours minimum at design flow.
- Select aeration method: Fine bubble diffused aeration (4–8% OTE per foot of submergence) is the standard for new plants; coarse bubble or surface aeration are used in special cases (industrial, foam-prone, freezing).
- Specify blower technology: Multistage centrifugal for steady high-flow plants; turbo blowers for variable-flow plants needing tight DO control; positive displacement for very small plants.
- Specify DO control: Manual DO control (constant blower output) is acceptable only for the smallest plants; modern plants use most-open-valve, ammonia-based, or model-predictive control.
- Plan redundancy: Multiple parallel basins, multiple blowers with N+1 redundancy, and bypass capability for basin maintenance.
Plant Size and Operational Considerations
Small plants (under 1 MGD) typically use extended aeration in single basins with surface aerators or coarse bubble diffusers, prioritizing simplicity over peak efficiency. Mid-sized plants (1–10 MGD) use fine bubble diffused aeration in two or more parallel basins with multistage centrifugal or turbo blowers and DO control. Large plants (over 10 MGD) typically use multiple parallel trains with sophisticated zone-by-zone DO control, ammonia-based aeration control, and supervisory optimization. Operator skill matters because modern aeration systems with model-predictive control can deliver 20–40% energy savings versus constant-DO control, but require operators trained to interpret and trust the controls rather than override them.
Comparison: Aeration Tank Configurations and Aeration Technologies
| Configuration / Technology | Typical HRT | Typical OTE (Clean Water) | Best-Fit Application | Energy Profile | Key Advantage |
|---|---|---|---|---|---|
| Conventional Activated Sludge (Plug Flow) | 4–8 hr | Diffuser-dependent | Mid to large municipal plants | Moderate | High BOD removal, reliable |
| Extended Aeration | 18–36 hr | Diffuser-dependent | Small plants, package systems | Higher per unit BOD | Robust, simple operation |
| Sequencing Batch Reactor (SBR) | Cycle-dependent | Diffuser-dependent | Small to mid plants, variable flow | Variable | Equalization built into cycle |
| Oxidation Ditch | 18–36 hr | Surface aerator-dependent | Small to mid plants, BNR applications | Moderate to high | Combined aeration and mixing |
| Membrane Bioreactor (MBR) | 4–8 hr (HRT); 15–30 days (SRT) | Higher than conventional due to elevated MLSS | Reuse-quality effluent, compact footprint | Higher (membrane scour adds load) | Complete biomass retention |
| Fine Bubble Diffused Aeration | — | 4–8% per foot submergence | Most modern municipal plants | Best energy efficiency | Highest OTE |
| Coarse Bubble Diffused Aeration | — | 1–3% per foot submergence | High-FOG, industrial, mixing-priority | Lower OTE; resistant to fouling | Less fouling, easier maintenance |
| Surface Mechanical Aeration | — | 2–4 lb O₂/hp-hr clean water | Oxidation ditches, lagoons, freezing concerns | Moderate OTE | No diffuser fouling; combined mixing |
| Multistage Centrifugal Blower | — | — | Steady high-flow plants | Limited turn-down | Reliable, well-understood |
| Turbo (High-Speed) Blower | — | — | Variable-flow plants needing DO control | Wide turn-down, high efficiency | Best part-load efficiency |
| Positive Displacement Blower | — | — | Very small plants, deep tanks | Constant flow, variable pressure | Tolerates pressure variation |
Field Notes: Practical Aeration Tank Operations
Commissioning Considerations
Commissioning a new or upgraded aeration system requires more than verifying that blowers run and diffusers bubble. The clean-water OTE test (per ASCE Standard 2-91) should be performed before plant startup to establish a baseline against which future fouled-condition performance can be measured. Diffuser air distribution should be visually inspected with the basin drained — uneven bubble patterns indicate header leveling problems or differential fouling that should be corrected before going into service. Blower performance curves should be verified at design flow and pressure with field instrumentation. DO sensors should be calibrated against laboratory Winkler titration before automatic control is enabled.
Pro Tip: During commissioning, document the baseline blower current draw, basin DO profile at three or more locations, and SOUR test results. These baselines become the reference for diagnosing fouling, biological upset, and controls drift over the operating life of the system.
Common Specification Mistakes
Three errors recur in aeration tank specifications. First, designers size the aeration system for average BOD load rather than peak summer load combined with full nitrification — a system with no margin during the hottest, highest-load weeks delivers unreliable nitrification at the worst possible time. Second, blower turn-down ratio is overlooked; plants with diurnal load variation of 4:1 or more cannot be served efficiently by blowers with 2:1 turn-down, leading to constant blower cycling or wasteful blow-off. Third, alpha factor (the ratio of process-water OTE to clean-water OTE) is assumed too high; conservative design uses alpha of 0.3–0.5 for fine bubble diffusers in mixed liquor, accounting for fouling over the diffuser service life.
Common Mistake: Assuming that adding more diffusers automatically increases oxygen transfer linearly. Beyond a critical density (typically 30–40% of basin floor coverage), additional diffusers provide diminishing OTE because adjacent bubble plumes interfere with each other. Specifications should target diffuser density as well as total diffuser count.
Operations & Maintenance Practice
Day-to-day aeration management revolves around three measurements: dissolved oxygen profile (multiple sensors across the basin), blower discharge pressure (rising indicates diffuser fouling), and aeration energy per pound of BOD removed (the integrated energy efficiency metric). Diffuser fouling is the dominant long-term concern — fine bubble membrane diffusers typically lose 30–50% of their clean-water OTE over 5–10 years of service, depending on water chemistry and operating conditions. Annual diffuser cleaning (typically with formic acid or hydrogen peroxide) restores most of the lost OTE; full diffuser replacement is typically required every 8–15 years.
Troubleshooting Aeration Upsets
The classic symptoms of aeration system problems are rising blower discharge pressure (indicates diffuser fouling), falling effluent ammonia performance with stable BOD performance (indicates oxygen-limited nitrification), or rising blower energy with stable BOD load (indicates loss of OTE somewhere in the system). Diagnosis follows a checklist: (1) verify DO sensor calibration, (2) measure DO profile across the basin to identify dead zones, (3) inspect blower performance curve against current operating point, (4) check diffuser air distribution from drained basin, (5) review SOUR and F/M to rule out biological upset before assuming aeration is the problem. Persistent aeration problems despite operational fixes usually indicate end-of-life diffusers, blower deterioration, or undersized aeration capacity for current load conditions.
Design Details & Standards
Sizing Methodology Overview
The standard aeration tank sizing workflow proceeds through four steps. Begin by calculating oxygen demand: actual oxygen requirement (AOR) in lb O₂/day from BOD load, nitrogenous oxygen demand from ammonia load, and endogenous respiration from biomass. Convert AOR to standard oxygen requirement (SOR) using temperature, alpha factor (typically 0.3–0.5 for fine bubble in mixed liquor), beta factor (typically 0.95), and DO saturation. Size the diffuser system to deliver SOR with margin for fouling — typically design at 60–70% of clean-water capacity to allow for end-of-life performance. Size blowers to deliver the diffuser airflow at design submergence pressure plus diffuser pressure drop plus piping losses, with adequate turn-down for diurnal variation.
Key Parameters That Differ by Application
Different aeration applications have different governing parameters. Conventional plug flow basins are governed by HRT, F/M ratio, and DO at the discharge end. Extended aeration basins are governed by SRT (often 20+ days) and total oxygen demand including endogenous respiration. SBRs are governed by cycle length, decant rate, and time-averaged oxygen delivery. MBR aeration includes biological aeration and separate membrane scour aeration with different design criteria. BNR systems require zone-by-zone DO control: aerobic zones at 2 mg/L for nitrification, anoxic zones below 0.5 mg/L for denitrification.
Applicable Standards
Several standards govern aeration system design and performance testing. ASCE Standard 2-91 (Measurement of Oxygen Transfer in Clean Water) is the standard test method for diffuser OTE certification. ANSI/HI 9.6.1 covers aeration blower applications. The Recommended Standards for Wastewater Facilities (Ten States Standards) sets minimum design criteria for aeration including air rates, basin geometry, and diffuser placement. WEF MOP 8 (Design of Municipal Wastewater Treatment Plants) and Metcalf & Eddy’s Wastewater Engineering: Treatment and Resource Recovery are the standard engineering references. WERF and EPA publications provide energy benchmarking targets for aeration system performance.
Specification Checklist
- Treatment goals defined: BOD only, BOD + nitrification, or full BNR
- Design loadings: BOD, ammonia, TKN, with peak summer conditions specified
- HRT and SRT calculated for design summer and winter conditions
- Oxygen demand calculated with margins for endogenous respiration and nitrification
- Alpha factor and fouling factor specified conservatively (0.3–0.5; 60–70% of clean-water capacity)
- Diffuser type selected: fine bubble for energy efficiency, coarse bubble for fouling resistance
- Diffuser density verified against bubble-interference threshold
- Blower technology selected: turbo, multistage centrifugal, or positive displacement
- Blower turn-down adequate for diurnal load variation
- Blower redundancy: N+1 minimum, considering peak summer service
- DO control strategy specified: most-open-valve, ammonia-based, or model-predictive
- DO sensor placement and redundancy planned
- Bypass capability for basin maintenance
- Diffuser cleaning and replacement plan documented
Frequently Asked Questions
What is an aeration tank and how does it work?
An aeration tank is a biological reactor in which air or pure oxygen is delivered to mixed liquor — wastewater combined with returned activated sludge — to support aerobic microbial degradation of organic pollutants and ammonia. Air is typically delivered through fine bubble diffusers at the basin floor or by mechanical surface aerators. The microbes consume BOD as a food source, converting it to carbon dioxide, water, and new biomass; nitrifying bacteria oxidize ammonia to nitrate. After sufficient contact time, the mixed liquor flows to a secondary clarifier where biomass settles and is returned to the aeration tank.
How is HRT different from SRT in aeration tanks?
Hydraulic retention time (HRT) is the average time water spends in the aeration tank — calculated as basin volume divided by influent flow. Solids retention time (SRT, also called sludge age) is the average time biomass spends in the system — calculated as biomass inventory divided by waste rate. The two are independent: HRT is set by influent flow and basin volume, while SRT is controlled by waste activated sludge pumping rate. Modern plants often use HRT of 4–8 hours and SRT of 5–15 days for nitrification; MBR systems decouple them further with HRT of 4–8 hours and SRT of 15–30 days.
What dissolved oxygen level should an aeration tank maintain?
Aerobic zones in an aeration tank typically maintain DO of 1.5–2.5 mg/L for reliable nitrification. DO below 1.0 mg/L causes nitrification to slow significantly; DO above 3.0 mg/L typically wastes blower energy without proportional treatment benefit. Anoxic zones in BNR systems maintain DO below 0.5 mg/L (ideally below 0.2 mg/L) to allow denitrification. Anaerobic zones for biological phosphorus removal maintain DO below 0.1 mg/L. Modern plants increasingly use ammonia-based aeration control rather than DO-based, varying DO setpoint based on effluent ammonia rather than holding DO constant.
How do I calculate aeration energy use?
The basic calculation works backward from oxygen demand. Calculate actual oxygen requirement (AOR) in lb O₂/day from BOD load (typically 1.0–1.2 lb O₂ per lb BOD) plus nitrogenous oxygen demand (4.57 lb O₂ per lb NH₃-N). Convert AOR to standard oxygen requirement (SOR) using alpha, beta, and temperature corrections. Divide SOR by aeration efficiency (lb O₂/hp-hr) to get blower horsepower; multiply by 0.746 to convert to kW; multiply by 24 hours to get daily energy. The simplified calculator widget elsewhere in this article provides planning-level estimates; final design requires detailed analysis of diffuser performance, blower curve, and control strategy.
How often should aeration tank diffusers be cleaned or replaced?
Fine bubble membrane diffusers in typical municipal service lose OTE through both biofouling (organic film and mineral scaling on the membrane surface) and material fatigue (membrane stiffening over time). Annual cleaning with formic acid or other approved cleaning agents typically restores 70–90% of the lost OTE — making it one of the highest-ROI maintenance activities at most plants. Full diffuser replacement is typically required every 8–15 years; the trigger is usually a combination of rising blower energy, deteriorated effluent quality, and visible diffuser membrane stiffening.
When does it make sense to retrofit aeration versus replace the entire basin?
The retrofit-versus-replace decision typically turns on basin condition and capacity needs. Retrofit makes sense when the basin shell is structurally sound, the volume is adequate for current and projected loads, and the limitation is purely in the aeration internals (diffusers, blowers, controls). Replacement becomes necessary when the basin is structurally deteriorated, when basin volume is inadequate for required HRT or SRT under permit changes, or when the existing geometry constrains BNR retrofit (no anoxic or anaerobic volume). Most utilities perform two or three diffuser replacement cycles before facing basin replacement; the economic crossover is usually around 30–40 years of basin service life depending on construction quality and maintenance history.
Conclusion
Key Takeaways
- Aeration tanks are the biological core of activated sludge plants — delivering oxygen to support microbial degradation of BOD and ammonia, and shaping the energy profile of the entire facility.
- Oxygen transfer efficiency drives energy cost — fine bubble diffusers at 4–8% OTE per foot submergence are the modern standard, with alpha factor and fouling reducing field performance by 50–70%.
- DO control strategy matters as much as equipment selection — modern most-open-valve, ammonia-based, or model-predictive control can deliver 20–40% energy savings compared with constant-DO control.
- Diffuser cleaning is the highest-ROI maintenance activity — annual cleaning typically restores 70–90% of lost OTE for a small fraction of replacement cost.
- Retrofit-versus-replace is the recurring capital decision — most utilities go through multiple retrofit cycles before basin replacement is justified, with the decision turning on basin condition, capacity needs, and permit requirements.
Aeration tanks remain the highest-leverage point in any activated sludge plant — accounting for 50–70% of plant electrical energy consumption and shaping effluent quality across BOD, ammonia, and nutrient parameters. Effective aeration design balances treatment performance, energy efficiency, capital cost, and operator workload, with modern controls and high-efficiency equipment delivering substantial improvements over legacy systems. Whether the project is a new plant, a major expansion, or a targeted upgrade to existing basins, the principles of oxygen demand calculation, diffuser selection, blower specification, and control strategy apply across all configurations and scales.