
Chemical Treatment Methods

Chemical Treatment in Water and Wastewater Practice
Safe drinking water and effective wastewater treatment are critical for protecting public health and the environment. Chemical technologies play an important role alongside physical and biological treatment methods. This article provides an overview of key chemical processes used, design considerations, and challenges for further improvement.
Chemical processes occupy a distinctive position within advanced treatment: they are rarely the whole answer on their own, but almost no treatment train works without them. Physical processes separate what is already separable and biological processes consume what is biodegradable. Chemical addition is what makes the difficult fraction tractable, by destabilizing colloids so they will settle, converting soluble contaminants into insoluble solids, oxidizing compounds that resist biology, and adjusting the water chemistry so that every other process can do its job.
That versatility comes with an operating cost and a residuals consequence. Chemicals are typically among the largest non-energy line items in a treatment budget, they consume alkalinity and shift pH in ways that propagate downstream, and every gram added either leaves in the effluent or leaves in the sludge. Sound chemical practice is therefore less about selecting a product than about understanding dose-response, alkalinity balance, residuals production, and the interactions between one chemical decision and the processes that follow it.
The sections below cover the core process chemistry, the subcategories within this area, a selection framework, comparison data, field practice, and the standards that govern chemical use in treatment facilities.
Core Chemical Treatment Processes
Chemically-Enhanced Sedimentation
Chemically-enhanced sedimentation (coagulation and flocculation) is used to remove suspended solids and enhance subsequent treatment steps. Chemicals such as lime, alum, and cationic/anionic polymers destabilize colloidal particles (0.01-1 μm) to form settleable flocs. Up to 90% removal of total suspended solids (60-90%) and phosphorus (70-90%) can be achieved.
The mechanism depends on the coagulant. Metal salts such as aluminum sulfate, ferric chloride, and polyaluminum chloride hydrolyze in water to form positively charged species that neutralize the negative surface charge holding colloids in suspension, then form hydroxide precipitates that sweep particles out of the water column. Polymers work primarily by bridging, with long chains physically linking destabilized particles into larger aggregates. Rapid mix energy has to be high enough to disperse the coagulant before hydrolysis completes, typically within seconds, while flocculation requires gentle, sustained mixing over 20 to 30 minutes to grow floc without shearing it apart.
Chemical Precipitation
Chemical precipitation with lime or metal salts like ferric chloride targets phosphorus, metals like zinc and copper, and other contaminants. It is a key step for controlling nutrient discharges to below 1 mg/L total phosphorus.
Precipitation chemistry is governed by solubility. Each target contaminant has a pH at which its precipitate is least soluble, and hitting that window is what separates effective removal from chemical waste. Most metal hydroxides reach minimum solubility somewhere between pH 8 and 11, but the optimum differs by metal, which is why mixed-metal industrial effluents often need staged treatment or a sulfide precipitation step rather than a single hydroxide dose. Phosphorus removal with metal salts requires a molar ratio of metal to phosphorus well above one, commonly in the range of 1.5 to 2.5 for low effluent targets, because competing reactions consume coagulant that never reaches the phosphate.
Disinfection and Advanced Oxidation
Disinfection uses oxidizing agents like chlorine (100-200 mg/L), ozone (0.5-5 mg/L), or UV radiation (100-5000 J/m2) to inactivate pathogens. A chlorine residual of 0.2-0.5 mg/L helps prevent regrowth. Concerns over disinfection byproducts have increased interest in ozone and UV approaches. Advanced oxidation processes (AOPs) using ozone, UV, or catalysts to generate hydroxyl radicals can also transform recalcitrant organic compounds.
Common Mistake: Confusing Applied Dose with Contact Requirement
Chlorine performance is governed by CT, the product of residual concentration and contact time, not by applied dose alone. In practice, municipal secondary effluent disinfection commonly uses applied doses in the range of roughly 5 to 20 mg/L, with higher figures reserved for poor-quality effluent, high ammonia demand, or specialty applications such as breakpoint chlorination and force main odor control. Doses in the hundreds of milligrams per litre belong to shock dosing and industrial contexts, not routine effluent disinfection. The practical implication is that a plant struggling to hit a coliform limit should first check contact basin baffling, short-circuiting, and chlorine demand from ammonia and organics, rather than simply raising the feed rate. Adding chlorine to compensate for a hydraulically short-circuited contact chamber increases both cost and disinfection byproduct formation without reliably improving inactivation.
Adsorption and Ion Exchange
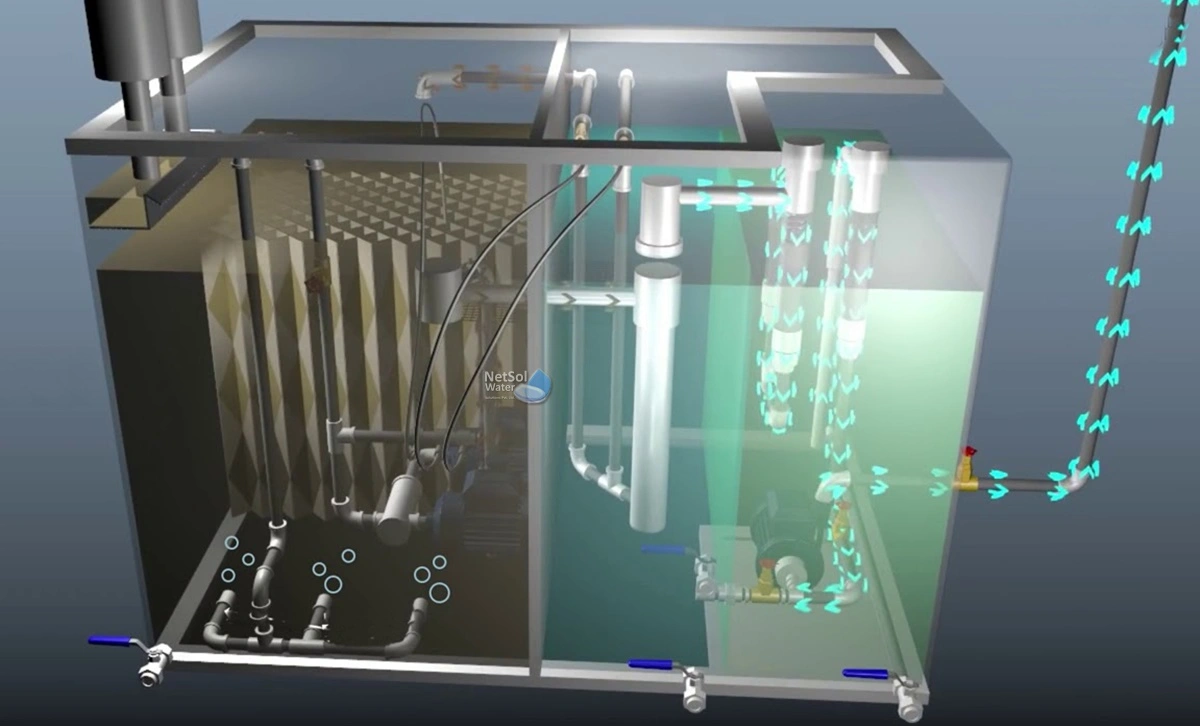
Adsorption onto activated carbon (700-1600 m2/g surface area) effectively removes many organic contaminants through rapid physical binding. Equilibrium & kinetic adsorption models help determine required doses. Ion exchange resins are used to replace undesired dissolved ions with less harmful ones, especially for water softening.
Both processes are separation rather than destruction technologies, which means the contaminant is concentrated rather than eliminated and the spent medium becomes a residual requiring management. Granular activated carbon in fixed beds is sized on empty bed contact time, commonly 10 to 20 minutes for organics removal, with breakthrough monitoring determining the reactivation interval. Ion exchange resins are selected by functional group and selectivity sequence, with strong acid cation resins used for softening, and specialty nitrate-selective and PFAS-selective resins available where a specific ion must be targeted against competing background ions. Regeneration produces a concentrated brine or waste stream whose disposal frequently governs whether the process is viable at a given site.
Subcategory Overview: Areas Within Chemical Treatment
Chemical treatment spans the reagents themselves, the parameters used to decide how much to dose, the specific contaminant problems that demand a chemical answer, and the optimization work that keeps consumption under control. The subsections below cover each area within this category.
Chemical Water Treatment Fundamentals
Chemical water treatment covers the drinking water side of this discipline, where the objectives differ meaningfully from wastewater practice. Potable treatment aims at turbidity reduction, pathogen inactivation, disinfection byproduct control, and delivery of water that will remain stable and non-corrosive throughout the distribution system. That last objective has no wastewater equivalent and drives a substantial portion of drinking water chemical practice, from corrosion inhibitor selection to finished water pH and alkalinity targets. Every chemical added to a potable stream must be certified to NSF/ANSI 60, which constrains product selection in ways that industrial and wastewater applications do not face.
Process Chemicals
The Process Chemicals area covers the supporting reagents that keep a plant running rather than the primary treatment chemistry: defoamers, antiscalants, biocides, cleaning chemicals, and odor control reagents. Foam control is a representative case, since foaming in aeration basins and digesters is disruptive out of proportion to its apparent severity, causing overflow, housekeeping problems, and inaccurate level readings. Silicone and non-silicone defoamers work by different mechanisms and interact differently with downstream processes, and overdosing can interfere with oxygen transfer or with membrane systems. These chemicals rarely appear in a process flow diagram but often account for a significant share of the chemical budget.
Wastewater Treatment Plant Chemicals
A working inventory of wastewater treatment plant chemicals maps each reagent to the unit process it serves and the hazard it presents. A typical municipal facility carries coagulant, polymer, hypochlorite or an alternative disinfectant, an alkalinity source such as caustic or magnesium hydroxide, and often supplemental carbon for denitrification. Each brings its own storage, containment, compatibility, and handling requirements, and several are dangerously incompatible with each other. Building the inventory as a list of chemical, purpose, dose range, storage arrangement, and incompatibilities is the basis of both the safety program and any meaningful cost analysis.
Chemical Treatment of Wastewater
Practical coverage of chemical treatment of wastewater focuses on how these reagents are applied within a municipal treatment train: chemically enhanced primary treatment ahead of the biological stage, coagulant addition for phosphorus removal at the point in the process where it works best, alkalinity supplementation to protect nitrification, and polymer conditioning ahead of thickening and dewatering. Dose point selection matters as much as dose rate, since the same coagulant added to primary influent, to mixed liquor, or to final effluent produces different removal efficiency, different sludge quantity, and different downstream consequences.
Degassing
Degassing removes dissolved gases that interfere with treatment, measurement, or distribution. Carbon dioxide stripping raises pH without chemical addition and is commonly used after acid-side treatment or in conjunction with lime softening. Dissolved oxygen removal is required ahead of certain membrane and boiler feed applications, while hydrogen sulfide stripping addresses both odor and corrosion. Methods include forced draft and packed tower aeration, vacuum degasification, and membrane contactors, with the choice driven by the gas being removed, the required residual, and whether off-gas treatment is needed to avoid transferring an odor problem to the atmosphere.
Process Optimization
The Process Optimization area addresses the treatment problems that require chemical tuning rather than new equipment, with color removal as a representative case. Color in effluent is usually caused by dissolved organics or dye compounds that pass through conventional treatment untouched, and the solutions range from enhanced coagulation at depressed pH, through oxidation with ozone or advanced oxidation, to adsorption on activated carbon. Optimization work of this kind almost always begins with bench testing, because the effective approach depends on the specific chromophore rather than on color as a general category.
Chemical Oxygen Demand
Chemical Oxygen Demand is the analytical parameter that underpins many chemical dosing decisions. COD measures the oxygen equivalent of organic matter oxidizable by a strong chemical oxidant, and unlike BOD it returns a result in hours rather than days, which makes it the practical control parameter for operational decisions. The COD to BOD ratio is diagnostic in its own right: a ratio near 2 suggests readily biodegradable wastewater, while a substantially higher ratio indicates recalcitrant organics that biological treatment will not remove and that may require oxidation or adsorption instead. Industrial pretreatment programs and surcharge billing both commonly rely on COD for the same reason.
Salinity Management
Salinity Management deals with the dissolved salt load that chemical treatment itself frequently increases. Every metal salt coagulant, every acid or caustic addition, and every ion exchange regeneration cycle adds ions that conventional treatment cannot remove. Where the effluent is destined for reuse, discharged to a salinity-limited receiving water, or recycled within an industrial process, that accumulation becomes a binding constraint. Options include source control on high-salinity industrial contributors, substituting lower-salinity reagents, and membrane processes for removal, but the least expensive answer is usually to avoid adding the salt in the first place.
Cyanide Treatment
Cyanide Treatment addresses one of the more demanding industrial applications in this category, arising from metal finishing, electroplating, mining, and coke production. Alkaline chlorination is the established method, oxidizing cyanide to cyanate and then to carbon dioxide and nitrogen in a two-stage process that must be held above pH 10 throughout, because dropping below that threshold releases hydrogen cyanide gas. Complexed cyanides bound to iron and other metals resist alkaline chlorination entirely and require alternative approaches such as hydrogen peroxide oxidation, SO2/air, or precipitation. This is a treatment area where process control failure has immediate life-safety consequences rather than merely permit consequences.
Selection and Specification Framework
Step One: Characterize the Water Before Selecting a Chemical
Chemical selection follows water chemistry, not the other way around. Establish alkalinity, pH, temperature, hardness, the target contaminant and its speciation, competing ions, and the seasonal range of each. Alkalinity deserves particular attention because it is consumed by nearly every acidic coagulant, and a water with limited buffering capacity will crash in pH at doses that a well-buffered water absorbs without difficulty. Contaminant speciation matters as much as concentration; phosphorus present as orthophosphate responds to metal salt addition, while much of the organic and condensed phosphorus fraction does not.
Step Two: Bench Test Before Committing
Jar testing is the least expensive step in the entire process and the one most often skipped. It establishes the dose-response relationship, identifies the pH window, compares candidate products on the actual water, and reveals the point of diminishing return beyond which additional chemical produces sludge rather than removal. Run tests across the seasonal range of water quality rather than on a single sample, and repeat when the source or the influent character changes materially. Where the objective is dewatering or thickening performance rather than clarification, bench work shifts to capillary suction time or filter leaf testing, but the principle is unchanged.
Step Three: Account for the Alkalinity and pH Consequences
Acidic coagulants consume alkalinity and depress pH, and the effect propagates. In wastewater treatment the classic failure mode is a coagulant dose that pushes mixed liquor alkalinity low enough to inhibit nitrification, converting a phosphorus solution into an ammonia violation. Nitrification itself also consumes alkalinity, so the two demands are additive. Where the raw water lacks buffering capacity, supplemental alkalinity from caustic soda, soda ash, magnesium hydroxide, or lime becomes part of the chemical program rather than an afterthought, and its cost belongs in the comparison between coagulant options.
Step Four: Quantify the Residuals
Every chemical added leaves in the effluent or in the solids. Metal salt coagulants generate chemical sludge in addition to the solids they remove, which increases thickening, dewatering, hauling, and disposal cost, and the added quantity is often substantial enough to reverse an apparent chemical cost advantage. Lime softening produces very large volumes of sludge. Ion exchange and membrane processes generate concentrated regenerant or reject streams. Comparing chemical options on delivered price per tonne without accounting for residuals routinely produces the wrong answer.
Step Five: Select the Dose Point
The location of chemical addition often matters more than the reagent. Coagulant added at a rapid mix ahead of primary clarification removes solids and phosphorus while reducing the load on biological treatment; the same coagulant added to mixed liquor achieves lower doses for phosphorus removal but increases inert solids in the system; added to final effluent it polishes but produces a tertiary residual. Adequate rapid mix energy at the dose point is essential for metal salts because hydrolysis is fast, while polymers require the opposite treatment, with gentle mixing to avoid shearing the chains that do the work.
Step Six: Design the Delivery System Around the Chemical
Storage and feed equipment must match the reagent’s specific properties. Sodium hypochlorite degrades with time and temperature and off-gasses, which vapor-locks conventional metering pump heads. Ferric chloride is aggressively corrosive and stains everything it contacts. Lime slurry settles and scales, requiring continuous agitation and regular line flushing. Polymer requires proper aging and dilution to activate. The equipment considerations are covered in depth under chemical feed systems, and they are not a detail to be resolved after the chemical decision is made.
Comparison Tables
| Process | Primary Target | Mechanism | Typical Dose Range | Key Limitation | Residual Produced |
|---|---|---|---|---|---|
| Coagulation and flocculation | Turbidity, colloids, TSS, phosphorus | Charge neutralization and bridging | Roughly 10–100 mg/L as product, water dependent | Consumes alkalinity; pH sensitive; performance varies seasonally | Chemical sludge additional to removed solids |
| Chemical precipitation | Phosphorus, metals, hardness, sulfate | Conversion to an insoluble solid at controlled pH | Stoichiometric plus excess; molar ratio typically 1.5–2.5 for low P | Narrow pH window per contaminant; mixed metals need staging | Large sludge volumes, particularly with lime |
| Chlorination | Pathogens, ammonia at breakpoint, odor | Oxidation and cell inactivation, governed by CT | Commonly 5–20 mg/L applied for secondary effluent | Disinfection byproducts; ammonia demand; may require dechlorination | DBPs; chloride added to effluent |
| Ozonation | Pathogens, taste and odor, color, micropollutants | Powerful oxidation; partial hydroxyl radical formation | Roughly 0.5–5 mg/L, application dependent | No residual; energy intensive; bromate formation in bromide waters | Off-gas requiring destruction; biodegradable byproducts |
| Advanced oxidation | Recalcitrant organics, micropollutants, taste and odor | Hydroxyl radical generation via UV/H₂O₂, ozone/H₂O₂, or UV/chlorine | Set by required log reduction of the target compound | High energy cost; scavenging by alkalinity and organics | Transformation products requiring evaluation |
| Adsorption (GAC/PAC) | Organics, taste and odor, some micropollutants | Physical binding to high surface area carbon | GAC empty bed contact time typically 10–20 minutes | Finite capacity; competitive adsorption; breakthrough monitoring required | Spent carbon for reactivation or disposal |
| Ion exchange | Hardness, nitrate, specific target ions | Reversible exchange of ions on a resin functional group | Sized on capacity and regeneration frequency | Competing ions reduce capacity; regenerant disposal | Concentrated brine or regenerant waste |
| pH and alkalinity adjustment | Process control, corrosion, nitrification support | Acid or base addition to shift equilibrium | Set by buffering capacity and target pH | Overcorrection is easy; strong reagents are hazardous | Added dissolved solids |
| Objective | First-Line Chemical Approach | Principal Constraint to Check |
|---|---|---|
| Phosphorus below 1 mg/L | Metal salt precipitation, dose point at primary or mixed liquor | Alkalinity consumption and nitrification inhibition |
| Phosphorus below 0.1 mg/L | Multi-point metal salt addition plus tertiary filtration | Sludge production and chemical cost escalation |
| Turbidity and TSS reduction | Coagulation and flocculation with clarification or filtration | Seasonal water quality variation; rapid mix energy |
| Pathogen inactivation | Chlorination with adequate CT, or UV where DBPs are a concern | Contact basin baffling; ammonia and organic demand |
| Recalcitrant organics and micropollutants | Ozone, advanced oxidation, or GAC adsorption | Energy cost; scavenging; transformation products |
| Metals removal from industrial effluent | Hydroxide or sulfide precipitation, staged by metal | pH window differs per metal; chelating agents defeat precipitation |
| Hardness reduction | Lime softening at scale, ion exchange at smaller scale | Sludge volume; brine disposal; salinity added |
| Nitrification support | Supplemental alkalinity via caustic, soda ash, or magnesium hydroxide | Combined demand from nitrification and coagulant addition |
Design and Operational Considerations
Key factors involve determining influent volumes/variability, analyzing waste production, ensuring reliability through redundancy, and evaluating environmental impacts. Understanding influent characteristics is vital for process selection and sizing. Jar testing helps optimize 20-200 mg/L chemical doses. Monitoring all process streams is necessary.
Field Notes
Commissioning Considerations
Verify metering pump calibration against a calibration column at several points across the turndown range rather than accepting the nameplate stroke setting, because pump output varies with discharge pressure and with the specific gravity of the chemical. Confirm that the dose point achieves adequate mixing at both minimum and maximum flow, since a diffuser sized for peak conditions frequently produces poor dispersion at night flows. Establish and document the baseline jar test dose-response curve at commissioning so that operators have a reference when performance changes. Confirm that secondary containment volumes, eyewash and safety shower placement, and incompatible chemical separation all match what was designed.
Common Specification Mistakes
- Selecting a coagulant on price per tonne. Products differ in active content, alkalinity consumption, and sludge production; the delivered cost per unit of contaminant removed is the only meaningful comparison.
- Ignoring alkalinity balance. A coagulant dose that solves phosphorus can inhibit nitrification and create an ammonia violation in its place.
- Sizing feed equipment only for the design dose. Turndown matters as much as capacity, and a pump that cannot meter accurately at low flow will overdose at night.
- Storing hypochlorite without accounting for degradation. Strength falls with time and temperature, so a fixed pump setting delivers a declining dose; storage should be sized for weeks, not months.
- Omitting proper polymer makedown. Polymer that is not adequately aged and diluted delivers a fraction of its potential performance regardless of dose.
- Failing to separate incompatible chemicals. Hypochlorite and acid in shared containment is the classic and most dangerous example.
- Treating jar testing as a startup activity. Water quality changes seasonally, and a dose optimized in summer is rarely correct in winter.
Operations and Maintenance Comparison
Coagulant systems concentrate maintenance on metering pump calibration, injection point fouling, and the corrosion that metal salts inflict on everything nearby; ferric installations in particular need diligent housekeeping and corrosion-resistant fasteners. Lime systems shift the burden to slurry handling, scale removal, and line flushing, and they are the most labor-intensive chemical system most plants operate. Hypochlorite systems require attention to degassing valve heads, flooded suction arrangements, and stock rotation. Polymer systems live or die on makedown equipment condition and dilution water quality. Ozone and UV move the burden from chemical handling to equipment maintenance, replacing chemical cost and storage hazard with electrical demand, lamp or generator servicing, and quartz sleeve cleaning.
Troubleshooting by Symptom
Poor floc formation at a historically adequate dose usually indicates a pH drift outside the coagulant’s effective window, a change in raw water character, or degraded polymer rather than an insufficient dose. Carryover of fine pin floc points to inadequate flocculation time or excessive mixing energy shearing the floc apart. Rising chlorine demand at unchanged effluent quality suggests increasing ammonia or organic load rather than a disinfection problem. Phosphorus results that worsen while dose stays constant frequently trace to a shift in phosphorus speciation or to alkalinity depletion limiting the reaction. Scaling and deposition at an injection point indicates the chemical is reacting at the point of addition rather than dispersing, and usually calls for a different diffuser or dose location.
Pro Tip: Track Cost per Unit of Contaminant Removed
Chemical budgets are usually tracked as dollars per month, which reveals nothing about whether the money is working. Recording chemical consumption normalized to the contaminant actually removed, such as dollars per pound of phosphorus removed or per million gallons treated at a given turbidity reduction, converts the chemical program into something measurable. The resulting trend exposes overdosing, degraded product, failing metering equipment, and seasonal opportunities to reduce dose, and it is usually the fastest route to a defensible reduction in chemical spend without touching effluent quality.
Design Details and Standards
Sizing Methodology
Chemical system sizing starts from the dose-response relationship established by bench testing, applied across the full range of design flows and water quality. Calculate the feed rate at minimum, average, and maximum conditions, then select metering equipment whose accurate turndown covers that whole span, adding a second pump rather than stretching one beyond its usable range. Size bulk storage for a delivery interval that reflects both supply logistics and the chemical’s shelf life, which for hypochlorite means weeks rather than the months that a stable reagent tolerates. Verify that rapid mix energy at the dose point is adequate for the reagent chemistry, and confirm that day tanks, containment, and transfer arrangements match the hazard classification of the material.
Key Parameters
- Rapid mix: high energy dispersion of metal salt coagulants within seconds of addition, since hydrolysis is essentially immediate.
- Flocculation: gentle, tapered mixing typically over 20 to 30 minutes, with velocity gradient decreasing through the basin to grow floc without shearing it.
- Alkalinity consumption: significant for alum and ferric chloride, and additive with nitrification demand in a biological plant.
- Metal to phosphorus molar ratio: commonly 1.5 to 2.5 for low effluent phosphorus targets, rising steeply as the target tightens.
- GAC empty bed contact time: typically 10 to 20 minutes for organics removal, with breakthrough monitoring setting the reactivation interval.
- Chlorine contact: governed by CT, with baffling factor determining how much of the nominal basin volume actually contributes.
- Metering pump turndown: accurate control generally limited to roughly 10 to 1 on a single pump, which is often narrower than the required dose span.
All values above are typical or approximate design guidance and should be confirmed against bench testing on the actual water, the governing state standard, and manufacturer data for the specific equipment.
Applicable Standards and References
NSF/ANSI 60 certifies chemicals for use in drinking water treatment and is a prerequisite for any reagent contacting a potable stream. The AWWA B-series standards specify treatment chemical quality by product, including B403 for aluminum sulfate, B406 for ferric sulfate, B407 for ferric chloride, and B300 for hypochlorite. 40 CFR Part 141 establishes National Primary Drinking Water Regulations, including the Stage 2 Disinfectants and Disinfection Byproducts Rule limits on total trihalomethanes and haloacetic acids. 40 CFR Part 133 defines secondary treatment requirements for wastewater. 40 CFR Part 68 establishes Risk Management Program requirements applicable to facilities storing threshold quantities of chlorine gas, and OSHA 29 CFR 1910.119 covers process safety management for the same materials. 29 CFR 1910.1200 governs hazard communication and safety data sheets for all treatment chemicals. NFPA 820 addresses fire protection and area classification in wastewater facilities, including chemical storage areas. Recommended Standards for Water Works and for Wastewater Facilities, the Ten States Standards, govern chemical feed redundancy, storage, and containment provisions in many states.
Specification Checklist
- Water characterization: alkalinity, pH, hardness, temperature, target contaminant and speciation, seasonal range
- Bench test results establishing dose-response and the effective pH window
- Design dose at minimum, average, and maximum flow, with the resulting feed rate span
- Chemical selection with active content, specific gravity, freezing point, and shelf life stated
- Alkalinity consumption and any supplemental alkalinity requirement
- Projected residuals: additional sludge quantity, regenerant or reject volume, added dissolved solids
- Dose point location and the mixing energy provided there
- Metering equipment type, accurate turndown, redundancy, and calibration provisions
- Bulk storage volume tied to delivery interval and shelf life, with secondary containment sized per code
- Material compatibility for tanks, piping, gaskets, and pumps
- Incompatible chemical separation and containment segregation
- Safety provisions: eyewash and shower locations, ventilation, gas detection, PPE, spill response
- NSF/ANSI 60 certification where the chemical contacts a potable stream
- Monitoring and control strategy, including feedback or flow-paced dosing and the signals reported to SCADA
Frequently Asked Questions
What is chemical treatment in water and wastewater?
Chemical treatment is the addition of reagents to change the physical or chemical state of contaminants so they can be removed or rendered harmless. It includes coagulation and flocculation to make colloids settleable, precipitation to convert dissolved contaminants into solids, oxidation and disinfection to destroy organics and inactivate pathogens, adsorption and ion exchange to transfer contaminants onto a medium, and pH and alkalinity adjustment to support every other process. It complements rather than replaces physical and biological treatment.
How do I choose between alum and ferric chloride?
Bench testing on the actual water is the only reliable basis, but some general tendencies hold. Ferric salts often perform better at low temperature and across a wider pH range, and are frequently more effective for phosphorus and for color removal. Alum is commonly less expensive per unit and less corrosive to handle. Ferric consumes more alkalinity per unit dose and stains equipment and structures persistently. Both produce chemical sludge in addition to the solids they remove, and that added quantity belongs in the cost comparison.
Why does coagulant dosing affect nitrification?
Acidic metal salt coagulants consume alkalinity as they hydrolyze, and nitrifying bacteria also consume alkalinity as they oxidize ammonia. The two demands are additive. In a plant with limited raw water buffering capacity, a coagulant dose sufficient for phosphorus removal can drive mixed liquor alkalinity low enough that pH falls and nitrification slows or stops. The fix is either supplemental alkalinity or a different dose point, and either way alkalinity should be monitored as part of the chemical program rather than assumed adequate.
What is jar testing and how often should it be done?
Jar testing runs several samples of the actual water at different chemical doses under controlled mixing, allowing dose-response and the effective pH window to be established at bench scale before committing full-scale chemical. It should be run at commissioning, whenever raw water or influent character changes materially, seasonally at minimum, and any time performance drifts without an obvious mechanical cause. It is the cheapest diagnostic tool available and the one most frequently neglected.
How is chemical dose different from chemical demand?
Dose is what is applied; demand is what the water consumes before any residual or removal is achieved. Chlorine illustrates the distinction clearly: ammonia, organics, sulfide, and reduced metals all exert demand that must be satisfied before free residual appears. A rising applied dose at constant residual therefore signals rising demand rather than a disinfection equipment problem. The same logic applies to coagulants, where competing reactions consume reagent that never reaches the target contaminant.
Do chemical treatment processes create their own problems?
Yes, and accounting for them is part of competent practice. Chlorination forms disinfection byproducts. Metal salts generate additional sludge and add dissolved solids. Ozone can form bromate in bromide-containing waters. Ion exchange and membrane processes produce concentrated waste streams. Lime softening produces very large sludge volumes. None of these is a reason to avoid chemical treatment, but each is a reason to evaluate the full consequence rather than only the removal efficiency.
How can a plant reduce chemical costs without hurting effluent quality?
Start by measuring consumption normalized to contaminant removed rather than by monthly spend. Then verify metering pump calibration, check that stored product has not degraded, re-run jar tests against current water quality, and evaluate whether the dose point is optimal. Flow-paced or feedback-controlled dosing typically outperforms fixed-rate feed, particularly at plants with wide diurnal flow variation. In most facilities, several of these produce measurable savings before any change of product is considered.
Challenges and Future Trends
Removing trace emerging contaminants (< 1 μg/L) and minimizing residual toxicity are becoming priorities, but the vast number of chemicals (>100,000 commercialized) poses prioritization and risk assessment challenges. Implementing advanced treatment globally also faces difficulties. However, water reuse and multi-barrier concepts are gaining support. Balancing treatment effectiveness and sustainability will shape further advances.
Conclusion
Key Takeaways
- Chemistry follows the water, not the catalogue — alkalinity, pH, temperature, and contaminant speciation determine which reagent will work, and bench testing on the actual water is the only reliable basis for selection.
- Alkalinity is the parameter most often overlooked — acidic coagulants and nitrification make additive demands, and a phosphorus solution that ignores this becomes an ammonia problem.
- Every gram added leaves in the effluent or the sludge — residuals production frequently reverses an apparent cost advantage, so compare on delivered cost per unit of contaminant removed.
- Dose point can matter more than dose rate — the same coagulant produces different removal, different sludge, and different downstream effects depending on where it enters the process.
- Measure the program, don’t just fund it — normalizing chemical consumption to contaminant removed exposes overdosing, degraded product, and failing metering equipment faster than any other diagnostic.
- Delivery equipment is part of the chemical decision — hypochlorite off-gassing, ferric corrosion, lime scaling, and polymer makedown each impose requirements that cannot be resolved after the reagent is chosen.
Chemical methods present indispensable treatment mechanisms but also implementation and contaminant challenges. Advances for removing priority pollutants while supporting water conservation and reuse efforts will require integrative social and technological solutions. Ongoing research across chemical, physical, and biological processes will be vital for affordable innovations that protect ecosystem and public health.
For the practitioner, the discipline reduces to a short sequence that holds across every application in this category: characterize the water, bench test before committing, account for the alkalinity and residuals consequences, choose the dose point deliberately, and design the delivery system around the specific reagent rather than around a generic chemical feed arrangement. Facilities that work through that sequence and then measure the result tend to spend less on chemicals and produce better effluent than those that inherit a dose setting and leave it alone.