
Submersible Troubleshooting: Symptoms
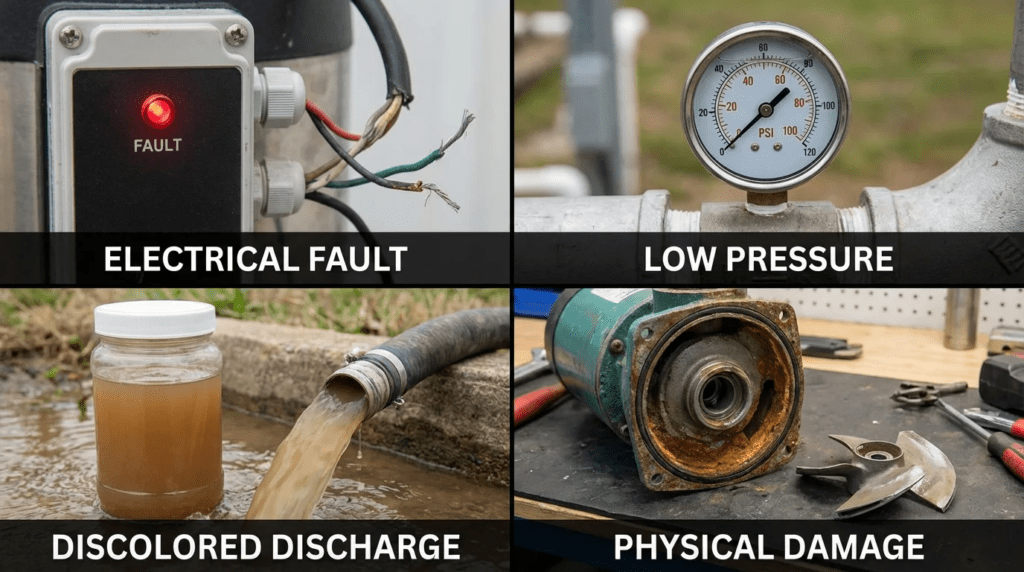
Introduction
In municipal wastewater lift stations and industrial effluent sumps, the submersible pump is often the most critical yet least visible asset. Because these units operate beneath the liquid surface, visual inspection during operation is impossible. Engineers and operators must rely on external data and performance anomalies to identify impending failures. A large share of submersible pump failures are not caused by pump age at all, but by system-side changes or initial misapplication that force the unit outside its allowable operating region.
For facility managers and plant engineers, waiting for a catastrophic trip or a high-water alarm is a costly maintenance strategy. Reactive repairs incur emergency mobilization fees, bypass pumping costs, and potential environmental penalties. The alternative is a rigorous analytical approach to Submersible Troubleshooting: Symptoms. By interpreting changes in amperage, discharge pressure, flow rates, and vibration signatures, engineers can identify root causes before total asset loss occurs.
This article addresses the engineering principles behind submersible pump diagnostics, from raw sewage to abrasive slurry handling. It builds on the same duty and metallurgy analysis covered in submersible pump materials selection, since a chronic symptom is frequently a specification decision surfacing years later. We will explore how proper specification influences diagnosability, how to interpret hydraulic and electrical data, and how to distinguish between pump defects and system-induced issues.
How to Select and Specify for Reliability and Diagnosability
Effective troubleshooting begins during the design phase. A pump specified without adequate monitoring provisions, or selected without considering the full range of the system curve, will inevitably present confusing symptoms. When analyzing Submersible Troubleshooting: Symptoms, the engineer must first verify whether the equipment was correctly selected for the current duty.
Duty Conditions & Operating Envelope
The most common source of chronic failure is operation away from the Best Efficiency Point. When specifying or diagnosing a pump, define the operating envelope, not just a single duty point.
- Continuous vs. Intermittent Duty: Submersibles rely on the surrounding fluid for motor cooling unless jacketed. Specifying a non-jacketed pump for snore operation or continuous running at low liquid levels produces thermal symptoms such as stator overheating despite mechanically sound bearings.
- Variable Speed Operation: If a VFD is used, the minimum flow must be calculated to maintain scouring velocity in the force main and to keep the pump out of the unstable region of its curve. VFD misapplication often shows up as check valve slamming or thermal overloads at low speed.
- Future Capacity: Oversizing pumps for 20-year flows forces operation far to the left of the curve during the early years, producing high radial loads and symptoms such as premature seal failure and shaft deflection.
Materials & Compatibility
Material mismatch creates symptoms that mimic mechanical failure but are chemical in origin.
- Corrosion: In low-pH industrial wastewater, standard cast iron volutes lose performance as clearances open up through graphitic corrosion, in which the iron matrix is selectively leached and a weak graphite skeleton remains. 316 stainless steel or CD4MCu duplex stainless should be specified where chlorides or acidity are a concern.
- Abrasion: For grit chambers or slurry service, rapid impeller wear producing low flow and head is a symptom of insufficient material hardness. High-chrome iron is required. A gray iron impeller showing worm-holing is exhibiting abrasion, which is frequently misdiagnosed as cavitation.
Hydraulics & Process Performance
- NPSH Available: In submersible applications NPSH available is usually generous because of submergence, but high-temperature industrial wastewater reduces it significantly. Cavitation symptoms — popping noise, pitted impeller vanes — indicate NPSH available has fallen below NPSH required.
- Solids Handling: Selecting the wrong impeller type for fibrous waste leads to ragging. The signature is a sawtooth amperage trace, spiking as material catches and dropping as it clears.
Installation Environment & Constructability
- Guide Rail Systems: Poorly specified or worn guide rails allow leakage at the discharge connection. The symptom is high motor amps with low measured discharge flow, as the pump recirculates into the wet well rather than down the force main.
- Cable Management: Specifications must include strain relief. Damaged cable entry points are the leading cause of moisture intrusion symptoms.
Reliability, Redundancy & Failure Modes
- Redundancy: In duplex or triplex stations, verify that the remaining pumps can handle peak inflow if one unit fails. If the backup trips on overload immediately after the primary fails, the symptom points to a system head calculation error rather than a pump defect.
- Sensor Packages: Modern submersibles should be specified with stator temperature detectors and seal leak sensors. Without these, troubleshooting is limited to amperage readings and inference.
Controls & Automation Interfaces
- SCADA Integration: Specifications should require trending of amps, runtime, and start counts. A sudden increase in starts per hour is a classic symptom of check valve failure or level control problems, and will eventually destroy the motor starter.
- Power Monitoring: Phase monitors are essential. Voltage unbalance symptoms can be diagnosed remotely if the controller records phase-to-phase voltage.
Maintainability, Safety & Access
- Lifting Apparatus: Safe removal is a prerequisite for physical inspection.
- Access Hatches: Must be sized to allow pump removal without entering the confined space.
Lifecycle Cost Drivers
Pumps without robust wear rings or hardened faces exhibit a characteristic lifecycle symptom: a rapid decline in hydraulic efficiency, measurable as increasing kW per million gallons pumped, within the first years of operation. Engineers must weigh the operating cost of that inefficiency against the capital cost of premium hydraulic ends.
You Cannot Troubleshoot a Station You Cannot Measure
Every diagnostic method in this article compares an observed value against an expected value. In most lift stations, the single most important observed value — flow — is not measured. There is no meter on the force main, and the pressure gauge, if one exists, has been dead for years. Without flow, amperage readings cannot be interpreted, because the same current can correspond to two entirely different points on the curve.
The drawdown test is how most stations get a flow number, and it is more accurate than its reputation if done carefully. Isolate the wet well from inflow if a gate or plug is available. Record the liquid level at two elevations a known vertical distance apart, time the interval for the pump to draw down between them, and multiply the wet well plan area by the drop to get volume. Flow equals volume divided by elapsed time.
Three things corrupt it, and all three are correctable. Inflow during the test is the largest error: if the well cannot be isolated, run a second test with the pump off, measure the fill rate over the same elevation band, and add that rate to the drawdown result. Wet well geometry is the second: plan area is rarely the simple rectangle on the drawing once benching, fillets, and a sloped floor are accounted for, so take the area from the as-built section within the specific elevation band being used, not the overall footprint. Level measurement accuracy is the third: a transducer reading through a grease cap or fouled stilling well will produce a confident and wrong answer, so verify against a staff gauge or tape before trusting the result.
Run the test at commissioning and annually thereafter, and record the simultaneous kW rather than amps. Amps alone omit power factor, which changes with load, so kW is the only input that supports a real wire-to-water calculation. The trend of gallons per kWh over years is the most useful single diagnostic a station can have, and it costs nothing but an afternoon.
Diagnostic and Symptom Comparison Tables
The following tables provide a framework for correlating observed symptoms with potential root causes and for selecting appropriate diagnostic technologies.
| Observed Symptom | Secondary Indication | Primary Hydraulic Cause | Primary Electrical Cause | Primary Mechanical Cause |
|---|---|---|---|---|
| No Flow / Low Flow | Low amperage | Air binding; clogged suction; discharge valve closed (a radial-flow centrifugal draws less power at shutoff, not more); worn clearances; system head above shutoff head | Phase loss (single phasing); low voltage | Sheared shaft; loose impeller on shaft |
| No Flow / Low Flow | High amperage | Rarely hydraulic — a centrifugal pump making no flow is generally drawing reduced power, so high amps point away from hydraulics | Motor winding fault; high drag in motor | Bound impeller (debris); seized bearing; rubbing |
| Excessive Vibration | Fluctuating amps | Cavitation; suction recirculation at low flow; vortexing | Rotor/stator eccentricity; VFD-induced resonance | Bent shaft; unbalanced or damaged impeller; worn bearings |
| Motor Overload Trip | Hot cable or housing | Specific gravity above design; operating at runout (too far right on the curve) | Voltage unbalance; insulation failure; loose connections | Seal faces dragging; bearing failure |
| Moisture Alarm | Not applicable | Not applicable | Cable jacket damage; capillary wicking in leads | Mechanical seal failure (inner or outer); O-ring failure |
| Diagnostic Technology | Primary Application | Best-Fit Symptoms to Diagnose | Limitations in Submersible Applications |
|---|---|---|---|
| Vibration Analysis (portable) | Periodic predictive maintenance routes | Bearing wear, unbalance, looseness | Requires lifting the pump or a permanently installed accelerometer; signal damped by surrounding water. |
| Insulation Resistance (megohmmeter) | Electrical integrity check | Insulation breakdown, moisture intrusion | Must be done de-energized; readings affected by cable length and temperature, so trend rather than single values. |
| Current Signature Analysis | Motor and load health | Rotor bar defects, cavitation, vortexing | Requires specialized equipment and interpretation. |
| Thermography | Control panel inspection | Loose connections, unbalanced loads, contactor failure | Cannot see the submerged motor; useful only for the panel and topside cabling. |
| Drawdown / Performance Test | Hydraulic verification | Wear ring clearance, impeller wear, system curve change | Needs accurate wet well geometry and level measurement; inflow must be isolated or separately measured. |
Engineer & Operator Field Notes
Commissioning & Acceptance Testing
Effective troubleshooting is impossible without a baseline. During commissioning of a new station or pump replacement, engineers must enforce rigorous acceptance testing.
- Drawdown Test: Verify volumetric flow rate by measuring wet well volume change over time and compare against the factory curve. A meaningful discrepancy at startup indicates an installation issue such as air entrainment or a partially closed valve.
- Electrical Baseline: Record voltage line-to-line and line-to-ground, amperage on all three legs, and insulation resistance. Calculate voltage unbalance. NEMA MG-1 directs that polyphase motors not be operated where voltage unbalance exceeds 1% without derating, and the resulting temperature rise increases roughly with the square of the unbalance — at 3.5% unbalance the additional heating is on the order of 25%.
- Vibration Baseline: For dry-pit submersibles, take baseline vibration readings on the bearing housing. For wet-pit units, confirm the guide rail system is tight and plumb; loose rails are a common source of apparent vibration symptoms.
- Record kW, Not Just Amps: Capture input kilowatts simultaneously with the flow measurement, so a wire-to-water efficiency baseline exists.
Common Specification Mistakes
- Over-Specifying Head: Excessive safety factors on friction loss produce a pump selected for high head that actually operates against low head. It runs out to the right of its curve, inviting cavitation, vibration, and overload.
- Ignoring Cable Length: In deep wells or long runs to the panel, voltage drop must be calculated. Low voltage at the motor terminals raises current and causes nuisance tripping.
- No Flow Measurement: Omitting a force main meter, or at minimum a calibrated wet well level signal and a documented wet well volume table, leaves the station undiagnosable.
O&M Burden & Strategy
- Routine Inspections: Check for changes in noise and track pump drawdown times. An increase in drawdown time is a leading indicator of impeller wear or a fouling check valve.
- Preventive Maintenance: Pull the pump annually. Inspect impeller clearance; for semi-open impellers, adjusting clearance restores efficiency. Check the oil chamber for a milky emulsion, which indicates the lower mechanical seal has failed.
- Predictive Maintenance: Trend insulation resistance. A single reading means little; a sharp downward trend indicates seal failure and moisture ingress before the leak sensor trips.
Troubleshooting Guide: Analyzing Symptoms
Symptom: Rapid Cycling
Root cause: usually not the pump. Look at level control settings with start and stop too close together, check valve failure allowing the column to drain back into the well, or wet well silting reducing effective volume.
Engineering action: review starts per hour in SCADA and verify check valve seating.
Symptom: High Amperage on All Three Legs
Root cause: overload. Specific gravity of the fluid increased, the pump is operating at runout against low head, or mechanical drag from bearings or rubbing.
Engineering action: throttle the discharge partially. If amps drop significantly, the pump was operating too far right on its curve, which is a hydraulic problem. If amps stay high, the cause is mechanical drag or a stator fault.
Symptom: Flow Down, Amps Roughly Unchanged
Root cause: internal recirculation across worn wear rings or open impeller clearance. The pump still does work, but an increasing fraction of it circulates internally.
Engineering action: measure flow by drawdown, compare gallons per kWh against the commissioning baseline, then pull and gauge the clearances.
Design Details and Calculations for Diagnostics
Verifying the System Curve
When a pump underperforms, verify the system head curve. The system may have changed since the original design through force main tuberculation, added parallel pumps, or a modified discharge elevation.
- Calculate Static Head: measure the vertical distance from the current wet well level to the discharge point.
- Estimate Friction Head. Using Hazen-Williams in US customary units, the head loss per 100 feet of pipe is:
hf,100 = 0.2083 × (100 ÷ C)1.852 × Q1.852 ÷ d4.8655
where hf,100 is feet of head per 100 feet of pipe, Q is flow in gpm, d is inside diameter in inches, and C is the Hazen-Williams roughness coefficient. Total friction head is then hf,100 multiplied by the pipe length in feet and divided by 100. Add fitting and valve losses separately. For an aged, tuberculated force main, use a reduced C value; assuming the design value is the most common reason a calculated curve does not match the field.
- Compare to the Pump Curve: plot static plus friction head against the pump curve. The intersection is the predicted operating point. If measured flow is materially below it, look for internal wear, suction blockage, or a higher-than-assumed force main roughness.
Specification Checklist for Diagnosability
- Acceptance Testing: require testing per ANSI/HI 11.6 for submersible pumps, with vibration data recorded during the test.
- Flow Verification Provision: require a wet well volume table by elevation in the O&M manual, and either a force main meter or a documented drawdown procedure.
- Cable Identification: require permanently marked cord caps. Confusion between power and sensor cables causes wiring errors with severe consequences.
- Monitoring Relay: specify a pump protection relay compatible with the specific manufacturer’s leak and thermal sensors. Generic relays often misinterpret proprietary sensor resistance values.
Standards & Compliance
- ANSI/HI 11.6: Rotodynamic Submersible Pumps — hydraulic performance, hydrostatic pressure, mechanical, and electrical acceptance tests.
- NEMA MG-1: motors and generators; defines voltage unbalance limits, derating, and insulation classes.
- NFPA 70 (NEC): Article 430 for motor circuits, and Articles 500 and 501 for classified locations where applicable.
Frequently Asked Questions
What symptoms indicate mechanical seal failure?
The most direct symptom is activation of the moisture or leak sensor in the seal chamber. Earlier warning signs include a milky emulsion in the oil during routine changes and a declining insulation resistance trend. If the outer seal fails, water enters the oil buffer chamber; if the inner seal also fails, water reaches the stator and produces a ground fault.
How do I distinguish electrical from mechanical vibration?
Electrical vibration, typically from rotor-stator eccentricity or drive harmonics, disappears immediately when power is removed. Mechanical vibration from unbalance, a bent shaft, or a failing bearing persists during coast-down. Observing the signature through coast-down separates the two.
Why does my submersible pump trip the overload on startup?
An immediate trip usually indicates a locked rotor from debris or a seized bearing, or a short in the winding or cable. If the pump runs briefly before tripping, look at high inertia loads, voltage dip during inrush, or incorrect soft-start settings.
What is the impact of voltage unbalance on submersible pumps?
Significant. Percent current unbalance typically runs several times the percent voltage unbalance, concentrating heat in one phase of the stator winding. NEMA MG-1 directs that motors not be operated above 1% voltage unbalance without derating. If a motor is overheating while flow and head appear normal, measure phase-to-phase voltage before pulling the pump.
How does impeller wear affect performance diagnosis?
As impellers and wear rings erode, the clearance between the suction side and the volute increases, allowing high-pressure fluid to recirculate to the eye. The symptom is a gradual reduction in flow and discharge pressure while amperage stays roughly constant or drops slightly. In wastewater, clearances should be gauged annually and adjusted or replaced to restore the curve.
Can a VFD cause bearing failure symptoms?
Yes. Drives can induce shaft voltages that discharge through the bearings, producing fluting damage. This appears as a high-pitched noise and premature bearing failure. Grounding rings or insulated bearings are appropriate for submersibles on drives.
How do chronic symptoms show up in the operating budget?
As a rising energy cost per million gallons and a rising repair frequency, both of which are easier to defend in a capital request than a description of noise. Quantifying that is the subject of the analysis of submersible lifecycle cost, while the single most common terminal symptom is examined in detail under submersible seal failure causes.
Conclusion
KEY TAKEAWAYS
- Baseline Data is Critical: You cannot troubleshoot deviations without commissioning data for flow, head, kW, and vibration.
- Measure Flow: Most stations cannot diagnose themselves because no one knows the flow. A documented drawdown procedure and a wet well volume table cost nothing and change everything.
- Verify the Curve First: A large share of problems are system-related. Confirm the pump is operating within its allowable envelope before pulling it for repair.
- Understand the Sensors: Differentiate seal leak alarms, which are warnings, from thermal trips, which are protective actions.
- Amps Tell Half the Story: High amps generally mean high flow, low head, or mechanical drag. Low amps generally mean low flow, high head, or air binding. Neither is interpretable without a flow number.
- Material Selection Matters: Chronic failure symptoms often point to a mismatch between pump materials and fluid chemistry or abrasion.
Successfully navigating Submersible Troubleshooting: Symptoms requires a disciplined engineering approach that looks beyond the pump itself. While the immediate symptom may be a tripped breaker or a noisy unit, the root cause is usually found in the interaction between the machine, the fluid, and the power supply.
For consulting engineers and plant directors, the goal is to shift from symptom management to root cause elimination. By specifying pumps with adequate instrumentation, providing a means to measure flow, ensuring proper material selection, and conducting rigorous acceptance testing, the lifecycle cost of these assets can be reduced substantially. When a failure does occur, analyzing the specific symptoms against the hydraulic and electrical physics described here leads to accurate diagnoses rather than temporary fixes.