
Water Treatment Sensors & Analyzers: Complete Selection Guide
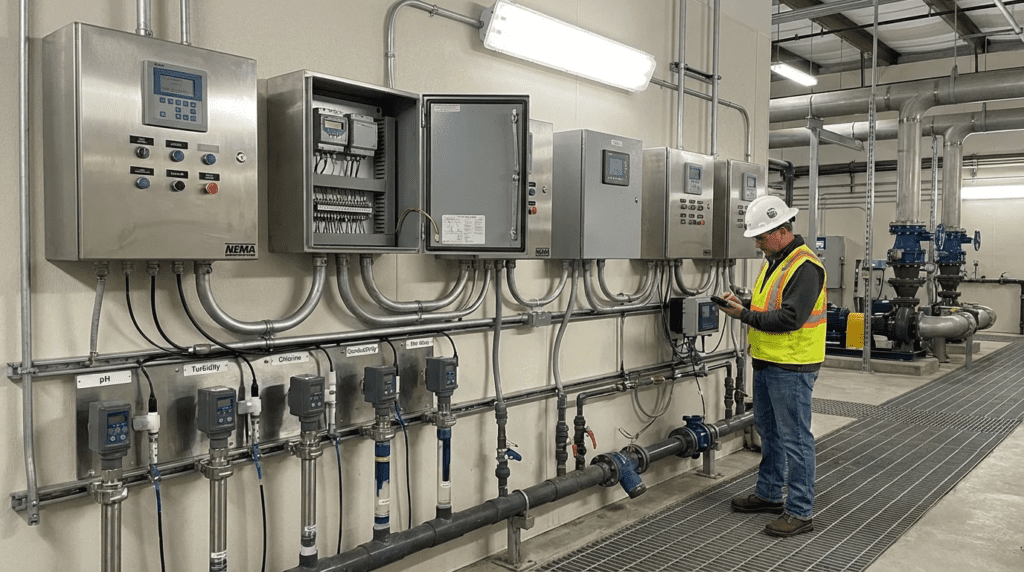
Introduction
In municipal and industrial water and wastewater facilities, a failing analytical sensor does not just drop a signal—it cascades into process upsets that can cost tens of thousands of dollars in chemical overdosing, cause severe corrosion, or trigger immediate regulatory compliance violations. Relying on blind assumptions rather than real-time data is no longer viable in modern plant operations. Therefore, a comprehensive selection framework for water treatment sensors and analyzers is critical for process engineers, plant directors, and instrumentation and controls (I&C) specialists tasked with optimizing plant performance. Properly specified instrumentation bridges the gap between raw hydraulics and intelligent process control.
Instrumentation is only half of a monitoring programme. The wider discipline of monitoring strategy and data integrity covers what happens to the signal after the sensor produces it — transmission, storage, security, and reliance for compliance reporting. As plants move to digital sensor networks and remote access, the instrument network becomes part of the facility’s control system attack surface.
This article serves as the foundational pillar for understanding the vast landscape of analytical instrumentation. The world of online water quality monitoring is broadly categorized by the parameters being measured (e.g., pH, solids, nutrients, organics), the underlying measurement technologies (e.g., optical, electrochemical, colorimetric), and the physical form factors required for different installation environments. An engineer must weigh capital expenditure (CAPEX) against the long-term operational expenditure (OPEX) of consumables, reagents, and calibration labor. This guide explores every major subcategory, detailing decision frameworks, standard design details, specification pitfalls, and field-proven operational notes to ensure reliable, lifecycle-optimized instrumentation networks.
Subcategory Landscape — Types, Technologies & Approaches
The analytical instrumentation landscape is vast, divided primarily by the physical, chemical, or biological property being quantified, followed by the specific detection technology and the mechanical installation approach. Engineers must navigate this matrix carefully, as a technology that works flawlessly in high-purity industrial water may foul within hours in a municipal mixed liquor basin. The following sections detail the core subcategories of water treatment sensors and analyzers, outlining their mechanisms, applications, and critical specification limits.
Electrochemical & Potentiometric Parameters
pH sensors represent the most ubiquitous measurement in water treatment, relying on a potentiometric measurement between a measurement electrode (typically hydrogen-ion sensitive glass) and a reference electrode. They are universally applied across municipal drinking water, wastewater neutralization, cooling towers, and reverse osmosis (RO) feed water to control scaling and chemical dosing. The primary advantage is their rapid, real-time response; however, their critical limitation is the susceptibility of the reference junction to poisoning or clogging by process contaminants (like sulfides or heavy metals). Engineers must carefully specify reference types (e.g., flowing liquid, gel-filled, solid-state polymer) based on the process fluid’s ionic strength and particulate load. Typical operational ranges are 0–14 pH, with extreme temperatures (>80°C) requiring specialized high-temperature glass formulations.
Online pH measurement is only trustworthy if verified against an independent method. Coverage of pH testing kits and portable verification addresses the handheld meters, buffers, and colorimetric kits used to check online instruments in the field. Without a defined verification procedure and acceptance tolerance, drift stays invisible until an upset or compliance sample reveals it.
ORP sensors (Oxidation-Reduction Potential) measure the tendency of an aqueous solution to gain or lose electrons, utilizing a noble metal electrode (usually platinum or gold) paired with a reference electrode. They are heavily utilized in industrial wastewater treatment for metal finishing (e.g., hexavalent chromium reduction, cyanide destruction) and municipal odor control scrubbers. The key advantage is providing a single, comprehensive value (-1000 to +1000 mV typical) indicating the overall oxidative or reductive state of the water. Their limitation is that ORP is non-specific; it cannot distinguish between different oxidizing agents. Selection relies heavily on matching the electrode metal to the specific reaction (gold is preferred for cyanide oxidation, platinum for general use) and accounting for pH dependency, as ORP values shift significantly with pH changes.
Conductivity sensors measure the ability of water to pass an electrical current, which correlates directly to the concentration of dissolved ionic solids (TDS). They operate using either contacting electrodes (2-pole or 4-pole) or toroidal (inductive) coils. Contacting sensors are ideal for high-purity and boiler feed applications (measuring in µS/cm or MΩ·cm), offering extreme precision at low ionic strengths. Inductive sensors, conversely, have no wetted metal electrodes and are specified for highly corrosive, fouling, or high-concentration environments like chemical tank concentration monitoring or cooling tower blowdown. A critical specification factor is selecting the correct cell constant (K-factor) for contacting sensors: K=0.01 for ultrapure water, K=1.0 for typical drinking water, and K=10.0 for high brines.
Physical Property & Clarity Monitors
Turbidity meters utilize optical technology, typically nephelometry, where a light beam (incandescent or LED/laser) is directed into the sample, and a detector positioned at a 90-degree angle measures the light scattered by suspended particles. They are the strict regulatory standard for municipal drinking water filtration performance and membrane integrity testing. They offer high sensitivity at very low ranges (0.01 to 10.0 NTU), but are prone to errors from microscopic air bubbles or color interference. Engineers must specify between EPA Method 180.1 (tungsten lamp, visible light) or ISO 7027 (infrared LED, 860 nm) depending on local regulatory mandates and the presence of sample color.
Total suspended solids (TSS) sensors differ from turbidity by measuring higher concentrations of solids (typically 1,000 to 10,000+ mg/L) using optical backscatter, multi-angle light scattering, or acoustic attenuation. They are vital in municipal wastewater for monitoring mixed liquor suspended solids (MLSS) in aeration basins and return activated sludge (RAS) lines. The primary advantage is providing real-time biological mass data without waiting for laboratory gravimetric tests. However, they require careful in-situ calibration to the specific characteristics (size, shape, color) of the plant’s sludge. Wiper mechanisms or air-blast cleaning are virtually mandatory for these sensors to prevent biofouling.
UV transmittance (UVT) monitors measure the percentage of ultraviolet light (specifically at 254 nm) that passes through a water sample over a standardized path length (typically 1 cm). They are critical for pacing the dosage of UV disinfection systems in municipal water and wastewater; as UVT drops (due to dissolved organics or suspended solids), UV reactor power must increase to maintain the validated dose. Online UVT monitoring allows for significant energy savings compared to running UV reactors at full power based on worst-case grab samples. Engineers must specify automated wipers and automatic zero-calibration features, as quartz lens fouling will falsely lower the UVT reading and unnecessarily spike UV power consumption.
Sludge blanket level detectors use ultrasonic acoustic pulses or optical arrays to locate the distinct interface between clear supernatant water and settled sludge in clarifiers and thickeners. They are used to automate sludge wasting pumps, preventing blanket washouts into the effluent or excessive solids retention times. Ultrasonic detectors bounce a sound wave off the density change, requiring the specification of the correct frequency depending on sludge fluffiness. Optical variants involve a sensor physically descending on a cable until it registers high solids. Subsurface skimmers, rake arms, and rising gas bubbles can interfere with ultrasonic models, requiring sophisticated echo-profile filtering in the transmitter.
Disinfectant & Oxidant Analyzers
Free chlorine analyzers measure the active forms of hypochlorous acid (HOCl) and hypochlorite ion (OCl⁻) in drinking water distribution, RO feed dechlorination, and cooling water. They generally utilize either amperometric or DPD colorimetric technologies. The major advantage of online measurement is ensuring pathogen deactivation while minimizing hazardous disinfection byproducts (DBPs) through tight PID control. Because the ratio of HOCl to OCl⁻ shifts dramatically with pH, amperometric chlorine sensors must be accompanied by continuous pH compensation or mechanical sample buffering. Engineers must select sensors with appropriate detection limits, typically sizing for 0–5.0 mg/L in distribution or ultra-low (0–0.05 mg/L) for RO protection.
Total residual chlorine analyzers measure both free chlorine and combined chlorine (chloramines), which is legally required for treated wastewater effluent discharging into sensitive receiving streams to prevent aquatic toxicity. Like free chlorine monitors, they employ amperometric or DPD chemical methods, but total chlorine measurement often requires the addition of potassium iodide and buffer reagents. They are heavily favored in municipal wastewater outfalls and chloraminated drinking water systems. When specifying, engineers must heavily weigh the OPEX of reagent replenishment (typically required every 30 days) against the lower-maintenance but highly flow-sensitive and chemically complex amperometric alternatives.
Ozone analyzers monitor dissolved ozone concentrations in advanced oxidation processes (AOP), taste and odor control in drinking water, and high-purity pharmaceutical water sanitization. Because ozone is highly volatile and unstable, measurement is exclusively done via real-time amperometric sensors directly in the process line or via ultra-short bypass lines. They provide fast response (T90 under 60 seconds) essential for dosing control. The critical specification limitation is system pressure and off-gassing; if bubbles form on the sensor membrane, the reading drops artificially. Specifying a pressurized flow cell and selecting robust membrane materials (like PFA) resistant to extreme oxidation is mandatory.
Dissolved Gas & Nutrient Analyzers
Dissolved oxygen (DO) sensors measure the concentration of gaseous oxygen dissolved in water, acting as the primary control parameter for aeration blower pacing in activated sludge wastewater plants. Aeration accounts for 50-60% of plant energy use, making DO accuracy highly valuable. Historically relying on galvanic or polarographic membranes, the modern standard utilizes optical/luminescent sensors. These sensors must withstand highly fouling environments; optical variants require no flow across the sensor and no electrolyte replacement, drastically reducing maintenance. Specifications should target ranges of 0–20 mg/L, and engineers must ensure the transmitter includes compensation algorithms for temperature, salinity, and barometric pressure.
Ammonia analyzers provide continuous measurement of NH₃/NH₄⁺ in wastewater aeration basins to optimize nitrification processes, or in raw drinking water intakes to adjust chlorination dosages (preventing breakpoint chlorination issues). Technologies include ion-selective electrodes (ISE) or colorimetric analyzers utilizing salicylate methods. ISE-based analyzers provide rapid, reagent-free responses ideal for biological aeration control (coupled with DO data for feed-forward control), but suffer from potassium interference. Colorimetric variants are highly accurate but require a filtered sample, reagent management, and generate chemical waste, making them better suited for final effluent compliance monitoring rather than raw aeration control.
Nitrate/nitrite analyzers monitor oxidized nitrogen species, crucial for validating denitrification in wastewater BNR (Biological Nutrient Removal) processes and monitoring agricultural runoff in drinking water sources. They predominantly utilize UV absorption spectrometry (measuring absorbance at specific UV wavelengths, typically around 210 nm) or ISE technologies. UV-based analyzers are highly desirable because they are optical, reagent-free, and respond instantly, allowing operators to tightly control mixed liquor recycle pumps and external carbon dosing. The major limitation is interference from organic matter and turbidity, requiring the sensor’s internal algorithms to measure and subtract dual-wavelength interferences.
Organic Load Analyzers
Total organic carbon (TOC) analyzers offer a rapid, precise measurement of all carbon covalently bonded in organic molecules, utilized in high-purity pharmaceutical water, boiler condensate leak detection, and municipal drinking water (to track DBP precursors). They operate by oxidizing organic carbon into CO₂ (via UV-persulfate, high-temperature combustion, or ozone) and measuring the CO₂ via Non-Dispersive Infrared (NDIR) or membrane conductivity. They are the reference method for continuous organics monitoring because they process samples in minutes rather than days. Specification requires choosing the oxidation method based on the matrix: UV-persulfate for clean municipal water (0-50 mg/L), and high-temperature combustion for heavy industrial wastewater with high particulates or salts.
Chemical oxygen demand (COD) analyzers and biochemical oxygen demand (BOD) analyzers traditionally require 2-hour laboratory digestion or 5-day biological incubation, respectively. For online monitoring, true COD/BOD analyzers are rare due to hazardous reagents (dichromate, mercury). Instead, modern continuous systems utilize UV-Vis spectrometry as a surrogate measurement, continuously measuring organic light absorption and using site-specific empirical algorithms to correlate to COD or BOD values.
The instrument behind that approach is covered in guidance on the UV254 analyzer, which measures absorbance at 254 nm as a proxy for aromatic and unsaturated organic content. The relationship to COD, BOD, or TOC is empirical rather than fundamental — it holds only while stream composition stays stable. It is invaluable for detecting industrial shock loads at headworks, but strictly a trend indicator requiring recalibration against laboratory results when composition shifts.
Core Detection Technologies
The parameter measured is only half the equation; the underlying physics defines the performance envelope.
Amperometric sensors measure the current generated by the electrochemical reduction or oxidation of an analyte across a semi-permeable membrane. Commonly used for chlorine, ozone, and chlorine dioxide, they are highly responsive and require no chemical reagents, keeping OPEX very low. However, they are highly dependent on constant flow velocity across the membrane to replenish the analyte; if sample flow drops, the reading falsely reads zero. They also typically require pH compensation to maintain accuracy.
Colorimetric analyzers automate standard laboratory wet-chemistry methods by mixing water samples with precise doses of chemical reagents, waiting for a color change, and measuring the resulting absorbance with a photometer. Used heavily for total chlorine, silica, phosphorus, and ammonia, they provide unmatched accuracy and are generally immune to pH and flow variations. The major limitation is high OPEX—facilities must purchase, store, and dispose of chemical reagents monthly, and the complex internal tubing, pumps, and valves require frequent mechanical maintenance.
Optical/luminescent sensors rely on light interactions—fluorescence, scattering, or absorbance. This includes Luminescent DO (LDO), UV-nitrate, and optical suspended solids sensors. The dominant advantage is the elimination of consumable electrolytes, membranes, and reagents. They represent the lowest maintenance burden in the industry. The primary limitation is optical window fouling; if the sapphire or quartz lens is obscured by biofilm or scaling, the measurement fails, making mechanical wipers or air-blasts essential for wastewater duty.
Installation Configurations & Data Transmission
Inline/insertion sensors are mounted directly into pressurized process pipes via hot-tap ball valves or threaded tees. They are ideal for high-purity water, RO lines, and situations where sample loss is unacceptable. The challenge is that the sensor must withstand full process pressure and pipe velocity, and removing them for calibration requires specialized retraction hardware if the pipe cannot be depressurized.
Bypass/extractive analyzers route a small, continuous sample stream from the main process line to a wall-mounted panel containing the analyzer (common for colorimetric and high-end TOC analyzers), with the sample either drained or pumped back. They allow for precise pressure and flow regulation (using rotameters and pressure reducing valves) and easy operator access for maintenance. However, they introduce lag time based on the sample line length and require consideration of sample disposal.
Submersible/immersion sensors are suspended on cables or mounted on rigid PVC or stainless steel poles directly into open tanks, channels, or aeration basins. They are the standard for biological wastewater treatment. Specification must include ruggedizing the cables against UV damage and ensuring the sensor head is IP68 rated for continuous deep immersion. Mounting hardware must allow for easy swing-arm retrieval for weekly cleaning by operators.
Modern networks have transitioned to smart digital sensors paired with multi-parameter transmitters. Smart digital sensors contain internal microprocessors that convert the analog millivolt or microamp signal into a robust digital signal (e.g., Modbus RS-485) directly at the sensor head. This eliminates signal degradation over long cable runs and stores calibration data inside the sensor itself, allowing operators to calibrate sensors in the lab and hot-swap them in the field. Multi-parameter transmitters act as central hubs, accepting inputs from 2 to 8 different digital sensors simultaneously, drastically reducing the CAPEX of the control panel and simplifying integration into the plant SCADA system.
Finally, automated cleaning systems are essential subsystems for keeping sensors online in fouling environments. These include motorized mechanical wipers (for optical lenses), compressed air-blast nozzles (for DO and solids sensors in sludge), and automated acid wash systems (for inline pH sensors in scaling environments). Specifying automated cleaning increases CAPEX but heavily reduces the daily O&M burden of manual scrubbing, transforming an unreliable sensor into a trusted control variable.
Supporting Instrumentation and Installation Hardware
An analyzer never works alone. Around every instrument sits supporting hardware determining whether the measurement survives the environment, reaches the control system intact, and produces a usable record — rarely specified with the care given the sensor, and responsible for a disproportionate share of field problems blamed on the analyzer.
Process Isolation and Signal Protection
Where a pressure instrument must be protected from the process fluid, diaphragm seals provide the barrier — a flexible diaphragm separating the process from a fill fluid that transmits pressure to the gauge, keeping corrosive or crystallizing media off the sensing element. This matters most on sludge lines, chemical feed, and anywhere a plugged impulse line leaves an operator reading a pressure that stopped changing days earlier. The decisive points are fill fluid, diaphragm material against actual chemistry, and temperature-induced error across the ambient range.
Cold-climate sample lines and analyzer panels need freeze protection, the role of electric heat trace. A frozen sample line does not announce itself as a fault; it stops delivering fresh sample while the analyzer faithfully reports the last water it saw. Self-regulating cable is standard, and the circuit should be monitored so a failure alarms rather than presenting later as an inexplicably stable reading.
Control Loop and Final Element Feedback
A sensor’s output is only useful if something acts on it. Coverage of valve positioners addresses devices comparing a control signal against actual stem position and modulating the actuator until they agree, correcting for friction, packing wear, and pressure imbalance. Complementing them, position transmitters report stem position back to the control system. An analyzer that will not respond to a setpoint change is as often a stuck valve as a failing sensor, and position feedback settles that in seconds.
Discrete sequencing within the panel is handled by components such as timers and relays, governing backwash sequences, sample pump cycling, alarm interlocks, and delay logic preventing a momentary excursion from tripping a process. Even in fully PLC-controlled plants these persist as hardwired interlocks, precisely because they operate independently of the software.
Data Recording and Retention
Finally, the measurement must become a record. Guidance on recorders covers the paper, paperless, and electronic devices logging process variables over time — still required at many facilities for compliance documentation, and valuable everywhere for the trend history that makes troubleshooting possible. Settle retention and retrieval early: how long, in what format, and whether a regulator can be given it.
Selection & Specification Framework
Selecting the correct instrumentation requires a structured decision-making process. The fundamental engineering tradeoff is always Capital Expenditure (CAPEX) versus Operational Expenditure (OPEX), heavily influenced by plant size, operator skill, and the required control reliability.
1. Decision Tree Logic: Duty Conditions First
The first branching path in specification is the fluid matrix. Is the fluid “clean” (drinking water, RO permeate, boiler feed) or “dirty” (raw wastewater, mixed liquor, industrial effluent)?
- For clean water, prioritize inline/insertion sensors and amperometric sensors. Fouling is minimal, so high precision and low detection limits drive the choice.
- For dirty water, prioritize submersible/immersion sensors utilizing optical/luminescent sensors, and heavily specify automated cleaning systems. The primary goal here is surviving the aggressive environment.
2. CAPEX vs OPEX Tradeoffs
Engineers frequently make the mistake of selecting a low-cost sensor without calculating the 5-year lifecycle cost. For example, when measuring chlorine, an amperometric sensor may cost roughly $2,500 in capital and $100 a year in membrane and electrolyte maintenance. A colorimetric analyzer may cost $4,000 but require around $1,500 a year in continuous chemical reagents and tubing replacement. However, if the water matrix causes the amperometric sensor to drift and requires an operator to spend three hours a week calibrating it, the “cheap” sensor actually possesses a massive hidden labor OPEX. Reagent-based colorimetric analyzers are justified when compliance accuracy is non-negotiable and manual calibration labor is scarce.
3. Common Specification Pitfalls
- Ignoring sample lag times: specifying bypass/extractive analyzers located 100 feet from the extraction point utilizing 1/2-inch tubing at low flow. The analyzer might read accurately, but the 15-minute transport delay makes PID chemical dosing control impossible, leading to system oscillation.
- Mismatched materials of construction: specifying standard 316 stainless sensor bodies in ferric chloride or high-brine environments, leading to rapid pitting corrosion. Titanium or PVDF/CPVC must be specified for high chloride conditions.
- Over-specifying accuracy over repeatability: for process control (e.g., aeration blower pacing), an absolute accuracy of 0.01 mg/L DO is less critical than strict repeatability and lack of drift. Robust optical/luminescent sensors provide the necessary stability.
Two further resources support specification. Guidance on ultrasonic flow meters covers the flow measurement most analytical loops depend on — an analyzer paced by an inaccurate flow signal produces a precisely wrong dose. A survey of the top OEMs for water and wastewater instrumentation covers the supplier landscape once technology and configuration are settled.
Worked Example — The Real Cost of a Drifting Sensor
A 10 MGD plant doses sodium hypochlorite to a 1.0 mg/L free chlorine residual. The chlorine analyzer drifts low by 0.3 mg/L between weekly calibrations, so the control loop overdoses to compensate.
- Excess chlorine dosed: 10 MGD × 0.3 mg/L × 8.34 = 25 lb/day as available chlorine
- As 12.5% hypochlorite at roughly $1.10/gal: about 24 gal/day, or roughly $9,600 per year
- Calibration labor: 3 hours weekly at $65 loaded = $10,140 per year
- Combined annual cost of the drift: approximately $19,700
Against that, a colorimetric analyzer at $4,000 capital and $1,500 a year in reagents repays the difference in under four months and keeps repaying — before counting the DBP formation the overdose drives, or the compliance risk when drift reverses.
Drift is rarely priced during specification because it appears on no quotation, yet it surfaces as chemical overuse, operator hours, and instability. When comparing a low-maintenance technology against a low-capital one, put a number on expected drift and the labour to correct it.
Comparison Tables
The following tables provide a quick-reference matrix for selecting the appropriate technology and understanding application fit across various plant scenarios.
Table 1: Subcategory Technology & Maintenance Comparison
| Type/Technology | Key Features | Best-Fit Applications | Limitations | Relative CAPEX | Maintenance Profile |
|---|---|---|---|---|---|
| amperometric sensors | Reagentless, fast response, membrane-based | Clean water, drinking water chlorine, ozone control | Requires strict flow control; pH dependent | Low – Medium | Membrane and electrolyte replacement (3-6 months) |
| colorimetric analyzers | Wet-chemistry automation, highly accurate | Wastewater effluent, regulatory compliance tracking | Generates chemical waste; complex internal plumbing | High | Reagent refill (30 days); tubing swaps (annual) |
| optical/luminescent sensors | No electrolytes, minimal drift, highly robust | Wastewater aeration DO, TSS, UVT, organics | Susceptible to lens fouling; optical interference | Medium | Wiper blade changes (annual); sensor cap replacement (2-3 years) |
| total organic carbon (TOC) analyzers | True carbon quantification via oxidation/NDIR | High-purity water, boiler feed, drinking water raw intakes | High complexity; large footprint; high initial cost | Very High | UV lamp replacement; oxidation reagent refill; pump maintenance |
Table 2: Application Fit Matrix
| Application Scenario | Best-Fit Subcategory | Key Constraints | Operator Skill Required |
|---|---|---|---|
| WWTP aeration basin (high solids, fouling) | dissolved oxygen (DO) sensors (optical) with automated cleaning systems | Must survive severe biofouling and ragging | Basic — wiping and verification |
| Unmanned remote pumping station (chlorine) | colorimetric analyzers (DPD) | Needs 30+ days of unattended stability; amperometric sensors drift without frequent checks | Intermediate — reagent handling and wet-chemistry zeroing |
| Industrial boiler feed (high temp/pressure) | conductivity sensors (contacting, inline) | Sensors must withstand 100°C+ and high pressure; ultra-pure ranges require low cell constants | Advanced — calibration of ultra-pure instrumentation is delicate |
| Drinking water UV system pacing | UV transmittance (UVT) monitors (bypass) | Lenses must remain pristine; requires auto-zero and mechanical wiping | Basic — lamp and wiper replacement |
Engineer & Operator Field Notes
The gap between a P&ID drawing and field reality is defined by commissioning and maintenance. Even the highest-tier analyzer will output garbage data if installed incorrectly or neglected.
Commissioning Considerations Varying by Subcategory
Commissioning an analytical loop requires distinct procedures based on the technology. For bypass/extractive analyzers, commissioning must verify sample flow rates and ensure no air bubbles are trapped in the measuring cell, which will cause erratic spiking on turbidity meters and colorimeters. For submersible/immersion sensors, positioning is everything. A DO sensor placed directly above an air diffuser will falsely read high, starving the rest of the basin of oxygen. Ensure submersible sensors are placed in well-mixed zones representative of the bulk fluid, typically 2-3 feet below the surface to avoid floating grease.
Common Specification Mistakes
A frequent error is substituting UV254-based surrogate measurement for true digestion-based COD in industries with highly variable effluent chemistry (e.g., batch chemical manufacturing). UV254 is an excellent surrogate for stable matrices like municipal wastewater, but changing the chemical composition breaks the correlation. Another common mistake is failing to specify pressure reduction valves before inline/insertion sensors that utilize glass electrodes, such as pH sensors; high process pressure can force process fluid backward through the reference junction, instantly destroying the sensor.
O&M Comparison Across Subcategories
The daily reality for operators varies drastically depending on the chosen analyzer. Which subcategories require the most attention? Colorimetric analyzers and total organic carbon (TOC) analyzers are the most labor-intensive. Operators must manage monthly reagent replacements, empty chemical waste carboys, and perform bi-annual tubing and pump cassette replacements. This requires an intermediate to advanced skill level and strict inventory management to ensure reagents do not expire.
Conversely, optical/luminescent sensors paired with automated cleaning systems are virtually hands-off. An optical DO sensor with an air-blast cleaner may only require an operator to visually inspect it once a month and replace the luminophore sensor cap once every two years. Amperometric sensors fall in the middle; while reagentless, operators must check zero and span calibrations against a handheld DPD colorimeter weekly to account for membrane fouling and electrolyte depletion. Spare parts inventory for amperometric units must include spare membranes, O-rings, and specialized electrolyte gels.
Troubleshooting Overview: Root Causes by Subcategory
When readings drift or fail, root cause analysis is generally technology-specific:
- pH and ORP sensors: sluggish response is almost always a clogged reference junction. If the reading is completely erratic (jumping widely), suspect a ground loop. Ensure the tank or pipe is properly grounded or utilize a sensor with a built-in solution ground.
- Amperometric sensors: a sudden drop to zero (while a lab test confirms chemical is present) strongly indicates a loss of sample flow. Check rotameters, clean inline strainers, and ensure the sample pump has not air-locked.
- Turbidity meters: spiking readings in a clean water application usually indicate micro-bubbles. Increase backpressure on the sample discharge or install a bubble trap.
- Sludge blanket level detectors: loss of echo or erratic blanket levels often result from fluffy sludge lacking a defined interface, or interference from a rotating clarifier rake. Adjust the sensor’s signal filtering to blank out the rake’s passing.
Design Details & Standards
Engineers must follow strict fluid dynamics and regulatory standards to ensure the instruments perform as specified.
Sizing Methodology Overview
Sizing for analytical instruments usually applies to the sample conditioning systems rather than the sensor itself. For bypass/extractive analyzers, the sample transport line should be sized to achieve a minimum velocity of 1.5 ft/sec to keep particulates suspended, but ideally closer to 3.0 ft/sec to minimize lag time, where transport time equals line volume divided by flow rate. A transport time of less than 60 seconds is highly recommended for closed-loop PID control applications like chlorine dosing. If a long run is unavoidable, implement a “fast loop” where a large pump pushes a high volume of water near the analyzer, and a short branch tee feeds the analyzer at its required low flow rate (e.g., 250 mL/min), dumping the bulk flow back to the process.
Key Design Parameters Differentiating Subcategories
Design parameters shift based on the technology selected. If specifying colorimetric analyzers, the design must incorporate gravity drainage for the chemical waste line; any backpressure will flood the optical measuring cell and destroy the unit’s electronics. For inline/insertion sensors, the insertion depth is critical. The sensor tip must pass the laminar boundary layer near the pipe wall and reach the turbulent core (typically inserting one third of the way into the pipe diameter) to ensure representative measurement. For submersible/immersion sensors, specifying flexible conduit and stainless steel chain mounts is required to handle the torque forces in highly agitated aeration basins.
Applicable Standards & Compliance
Regulatory compliance heavily dictates specification. For municipal drinking water, instrumentation must comply with EPA-approved methods.
EPA Method 334.0: dictates stringent calibration and verification requirements for online free chlorine analyzers and total residual chlorine analyzers used for regulatory reporting. Amperometric sensors must be routinely verified against primary standards.
EPA Method 180.1 / ISO 7027: governs turbidity meters, specifically dictating the light source and angle of detection.
NEMA 4X / IP68: standard requirements for enclosures. Any multi-parameter transmitters mounted outdoors over open tanks must be NEMA 4X (corrosion and hose-down resistant). Submersible smart digital sensors must be IP68 rated for continuous depth immersion.Additional applicable frameworks: approved analytical methods derive from 40 CFR Part 136, with drinking water monitoring under 40 CFR Part 141. Instrument installation follows NFPA 70, with area classification under Article 500 where digester gas or chemical storage creates a classified location, and control panels built to UL 508A. Enclosures follow NEMA 250 and IEC 60529, heat trace circuits IEEE 515. Where instrument networks connect to plant control systems, ISA/IEC 62443 provides the industrial control system cybersecurity framework.
Specification Checklist
- Identify target parameter and required measuring range (normal, maximum, minimum).
- Select technology based on water matrix (clean versus fouling).
- Determine configuration: inline/insertion sensors, bypass panel, or submersible.
- Specify flow, temperature, and pressure constraints for the wetted parts.
- Determine required output signals (4-20mA, Modbus, Ethernet/IP, Profibus).
- Include necessary sample conditioning: pressure regulators, strainers, bubble traps.
- Specify automated maintenance: automated cleaning systems or auto-calibration hardware.
- Define necessary mounting hardware and sunshields for transmitters.
- Verification procedure and acceptance tolerance defined for every online instrument, with the independent method named.
- Supporting hardware specified explicitly: isolation seals, monitored freeze protection, valve position feedback, and data retention period and format.
FAQ Section
What are the different types of water treatment sensors and analyzers?
The landscape is divided by parameters and technologies. Core parameter types include pH sensors, ORP sensors, conductivity sensors, dissolved oxygen (DO) sensors, turbidity meters, total suspended solids (TSS) sensors, and sludge blanket level detectors. Disinfectant monitoring includes free chlorine analyzers, total residual chlorine analyzers, and ozone analyzers. Nutrient and organic tracking rely on ammonia analyzers, nitrate/nitrite analyzers, total organic carbon (TOC) analyzers, chemical oxygen demand (COD) analyzers, biochemical oxygen demand (BOD) analyzers, and UV transmittance (UVT) monitors. Technologies vary from amperometric sensors to colorimetric analyzers and optical/luminescent sensors, utilizing inline/insertion sensors, bypass/extractive analyzers, or submersible/immersion sensors, frequently integrated into smart digital sensors and multi-parameter transmitters with automated cleaning systems.
How do you choose between amperometric and colorimetric chlorine analyzers?
Choose amperometric sensors for clean water environments (like RO feed or clean distribution) where fast response times are needed for real-time PID control, and minimizing OPEX is a priority. Choose colorimetric analyzers (DPD) for regulatory compliance reporting, remote unmanned stations, or varying water matrices where the constant accuracy outweighs the high OPEX of monthly chemical reagent replacements.
What is the most cost-effective dissolved oxygen technology for small wastewater plants?
For long-term cost-effectiveness, optical/luminescent sensors are the industry standard. While galvanic and polarographic sensors have a lower initial CAPEX, the intense manual labor required to constantly replace membranes and refill electrolytes rapidly exceeds the cost difference. Optical dissolved oxygen (DO) sensors paired with air-blast automated cleaning systems provide highly reliable aeration control with minimal operator intervention.
How often do pH sensors need to be calibrated?
Calibration frequency depends entirely on the process. In clean, mild water such as drinking water, pH sensors may hold calibration for one to three months. In aggressive, hot, or highly fouling industrial wastewater, they may require weekly or even daily cleaning and two-point calibration. Utilizing smart digital sensors allows operators to swap pre-calibrated probes quickly, reducing downtime during these frequent intervals.
Why is my inline turbidity meter spiking erratically?
Erratic, high spikes on turbidity meters are typically caused by micro-bubbles in the sample stream, which scatter light just like suspended solids. Ensure that the sample is extracted from the side of the main pipe (not the top where air gathers) and implement a bubble trap or increase backpressure on the discharge of the measuring cell to force gases back into solution.
How do I combat severe biofouling on submersible optical sensors?
Biofouling on optical/luminescent sensors, such as total suspended solids (TSS) sensors and DO probes, must be addressed mechanically. High-flow environments help, but specifying built-in automated cleaning systems—either an integrated mechanical wiper that sweeps the lens every hour or a high-pressure air-blast system—is mandatory for reliable continuous operation in mixed liquor or primary effluent.
Why do instrument installations fail when the sensor itself is fine?
Because the sensor is the part everyone specifies carefully and the installation is the part nobody does. The recurring failures sit in supporting hardware: a plugged impulse line reporting a pressure that stopped changing days ago, a frozen sample line delivering stale water the analyzer reports faithfully, or a valve that is not where the controller thinks it is.
Prove the sample before doubting the sensor — confirm fresh fluid reaches the measuring cell, that flow is within specified range, and that the final control element responds. Most recorded sensor failures are sample delivery problems, and replacement cures them only temporarily, because the installation fault is still there when the new one goes in.
Conclusion
Key Takeaways: Specification Summary
- Matrix dictates technology: clean water favors inline/insertion sensors and fast amperometric sensors; dirty wastewater demands submersible/immersion sensors, optical/luminescent sensors, and robust automated cleaning systems.
- CAPEX vs. OPEX: do not specify colorimetric analyzers without accounting for the permanent operating budget required for monthly reagents and tubing replacements.
- Sample lines matter: bypass/extractive analyzers fail when sample runs are too long or pipes are too large, leading to massive lag times that ruin PID control.
- Digital is the standard: modernize networks with smart digital sensors and multi-parameter transmitters to reduce cabling costs, consolidate SCADA integration, and allow for off-site laboratory calibration.
- Interferences are inevitable: always consult the manufacturer on chemical interferences (e.g., potassium on ISE ammonia analyzers, or varying pH on non-compensated chlorine monitors).
- Price the Drift: a chlorine sensor drifting 0.3 mg/L at 10 MGD costs roughly $19,700 a year in excess chemical and calibration labour — a figure that appears in no vendor quotation.
- Specify the Installation: isolation seals, monitored freeze protection, valve position feedback, and data retention decide whether a correctly chosen instrument actually works.
Mastering analytical instrumentation selection is the difference between a water facility that runs reactively and one that operates proactively. Every subcategory—from simple conductivity sensors measuring TDS to complex total organic carbon (TOC) analyzers monitoring trace DBPs—serves a specific purpose and possesses hard mechanical limits. Engineers must meticulously match the technology to the water matrix, size sample conditioning lines for minimal lag, and respect the ongoing maintenance burdens placed on operations staff.
When selecting instrumentation, default to the most reliable physical principle with the lowest consumable burden, such as transitioning from titration to optical methods. However, recognize that high-accuracy compliance points may force the use of more complex, high-maintenance equipment. By balancing initial capital costs against lifecycle operational expenditures and leveraging digital integration, engineers can design analytical networks that act as the reliable nervous system for modern water and wastewater treatment automation.